Day 59: Project 4: Evaluation & Business Impact
✅ Today you will learn
- Open the locked test set – once
- ROC-AUC, PR-AUC, confusion matrix
- Gains & lift: value of calling the top 20%
- Pick the call list size by profit, not by 0.5
- Explain each prediction and check fairness
🏢 In the real world
The Head of Retention asks three questions before approving the budget: “How good is the model on customers it has never seen? How many people should my team call each month? How much money will we actually save?” Today you answer all three with numbers.
Step 1: the moment of truth
import numpy as np
import pandas as pd

def load_churn(path="telecom_churn.csv"):
    # "None" means no internet plan – stop pandas from turning it into NaN
    df = pd.read_csv(path, keep_default_na=False, na_values=[""])
    df["total_charges"] = df["total_charges"].fillna(df["monthly_charges"] * df["tenure_months"])
    df["churned"] = (df["churn"] == "Yes").astype(int)
    return df

def add_features(df):
    df = df.copy()
    df["tenure_band"] = pd.cut(df["tenure_months"], [0, 6, 12, 24, 48, 72], labels=["0-6", "7-12", "13-24", "25-48", "49-72"]).astype(str)
    df["is_new"] = (df["tenure_months"] <= 6).astype(int)
    df["has_complaint"] = (df["complaints"] > 0).astype(int)
    df["charge_per_gb"] = (df["monthly_charges"] / df["data_usage_gb"].clip(lower=1)).round(2)
    df["avg_monthly_paid"] = (df["total_charges"] / df["tenure_months"]).round(1)
    df["monthly_no_support"] = ((df["contract"] == "Monthly") & (df["tech_support"] == "No")).astype(int)
    return df

# original columns – the champion model uses these
NUM = ["senior_citizen", "tenure_months", "monthly_charges", "total_charges", "complaints", "data_usage_gb"]
CAT = ["gender", "contract", "internet_service", "tech_support", "payment_method"]
# original + engineered columns (tested on Day 58)
NUM_ALL = NUM + ["is_new", "has_complaint", "charge_per_gb", "avg_monthly_paid", "monthly_no_support"]
CAT_ALL = CAT + ["tenure_band"]

from sklearn.compose import ColumnTransformer
from sklearn.preprocessing import OneHotEncoder, StandardScaler
from sklearn.pipeline import Pipeline
from sklearn.linear_model import LogisticRegression
from sklearn.model_selection import train_test_split

df = add_features(load_churn())
X, y = df[NUM_ALL + CAT_ALL], df["churned"]          # keep all columns; each model picks what it needs
X_dev, X_test, y_dev, y_test = train_test_split(X, y, test_size=0.2, random_state=2025, stratify=y)

def make_model(C=0.1, num=NUM, cat=CAT):
    pre = ColumnTransformer([("num", StandardScaler(), num), ("cat", OneHotEncoder(handle_unknown="ignore"), cat)])
    return Pipeline([("prep", pre), ("clf", LogisticRegression(C=C, max_iter=5000))])

model = make_model().fit(X_dev, y_dev)                        # champion: original columns, C = 0.1
p_test = model.predict_proba(X_test)[:, 1]

from sklearn.metrics import roc_auc_score, average_precision_score, classification_report
print(f"TEST ROC-AUC = {roc_auc_score(y_test, p_test):.3f}   (CV on dev was ≈ 0.82)")
print(f"TEST PR-AUC  = {average_precision_score(y_test, p_test):.3f}   (random = {y_test.mean():.3f})")
print(classification_report(y_test, (p_test >= 0.5).astype(int), target_names=["stays", "churns"], digits=3))The test AUC is close to the cross-validation estimate. That means our process was honest: no leakage, no over-tuning. A big drop would have been a warning to investigate before going live.
import numpy as np
import pandas as pd

def load_churn(path="telecom_churn.csv"):
    # "None" means no internet plan – stop pandas from turning it into NaN
    df = pd.read_csv(path, keep_default_na=False, na_values=[""])
    df["total_charges"] = df["total_charges"].fillna(df["monthly_charges"] * df["tenure_months"])
    df["churned"] = (df["churn"] == "Yes").astype(int)
    return df

def add_features(df):
    df = df.copy()
    df["tenure_band"] = pd.cut(df["tenure_months"], [0, 6, 12, 24, 48, 72], labels=["0-6", "7-12", "13-24", "25-48", "49-72"]).astype(str)
    df["is_new"] = (df["tenure_months"] <= 6).astype(int)
    df["has_complaint"] = (df["complaints"] > 0).astype(int)
    df["charge_per_gb"] = (df["monthly_charges"] / df["data_usage_gb"].clip(lower=1)).round(2)
    df["avg_monthly_paid"] = (df["total_charges"] / df["tenure_months"]).round(1)
    df["monthly_no_support"] = ((df["contract"] == "Monthly") & (df["tech_support"] == "No")).astype(int)
    return df

# original columns – the champion model uses these
NUM = ["senior_citizen", "tenure_months", "monthly_charges", "total_charges", "complaints", "data_usage_gb"]
CAT = ["gender", "contract", "internet_service", "tech_support", "payment_method"]
# original + engineered columns (tested on Day 58)
NUM_ALL = NUM + ["is_new", "has_complaint", "charge_per_gb", "avg_monthly_paid", "monthly_no_support"]
CAT_ALL = CAT + ["tenure_band"]

from sklearn.compose import ColumnTransformer
from sklearn.preprocessing import OneHotEncoder, StandardScaler
from sklearn.pipeline import Pipeline
from sklearn.linear_model import LogisticRegression
from sklearn.model_selection import train_test_split

df = add_features(load_churn())
X, y = df[NUM_ALL + CAT_ALL], df["churned"]          # keep all columns; each model picks what it needs
X_dev, X_test, y_dev, y_test = train_test_split(X, y, test_size=0.2, random_state=2025, stratify=y)

def make_model(C=0.1, num=NUM, cat=CAT):
    pre = ColumnTransformer([("num", StandardScaler(), num), ("cat", OneHotEncoder(handle_unknown="ignore"), cat)])
    return Pipeline([("prep", pre), ("clf", LogisticRegression(C=C, max_iter=5000))])

model = make_model().fit(X_dev, y_dev)                        # champion: original columns, C = 0.1
p_test = model.predict_proba(X_test)[:, 1]

import matplotlib.pyplot as plt
from sklearn.metrics import RocCurveDisplay, PrecisionRecallDisplay, ConfusionMatrixDisplay
fig, ax = plt.subplots(1, 3, figsize=(15, 4.2))
RocCurveDisplay.from_predictions(y_test, p_test, ax=ax[0], name="champion"); ax[0].plot([0, 1], [0, 1], "k:"); ax[0].set_title("ROC curve (test)")
PrecisionRecallDisplay.from_predictions(y_test, p_test, ax=ax[1], name="champion"); ax[1].axhline(y_test.mean(), color="k", ls=":"); ax[1].set_title("Precision–recall (test)")
ConfusionMatrixDisplay.from_predictions(y_test, (p_test >= 0.5).astype(int), display_labels=["stays", "churns"], cmap="Blues", colorbar=False, ax=ax[2])
ax[2].set_title("Confusion matrix at 0.5")
plt.tight_layout(); plt.show()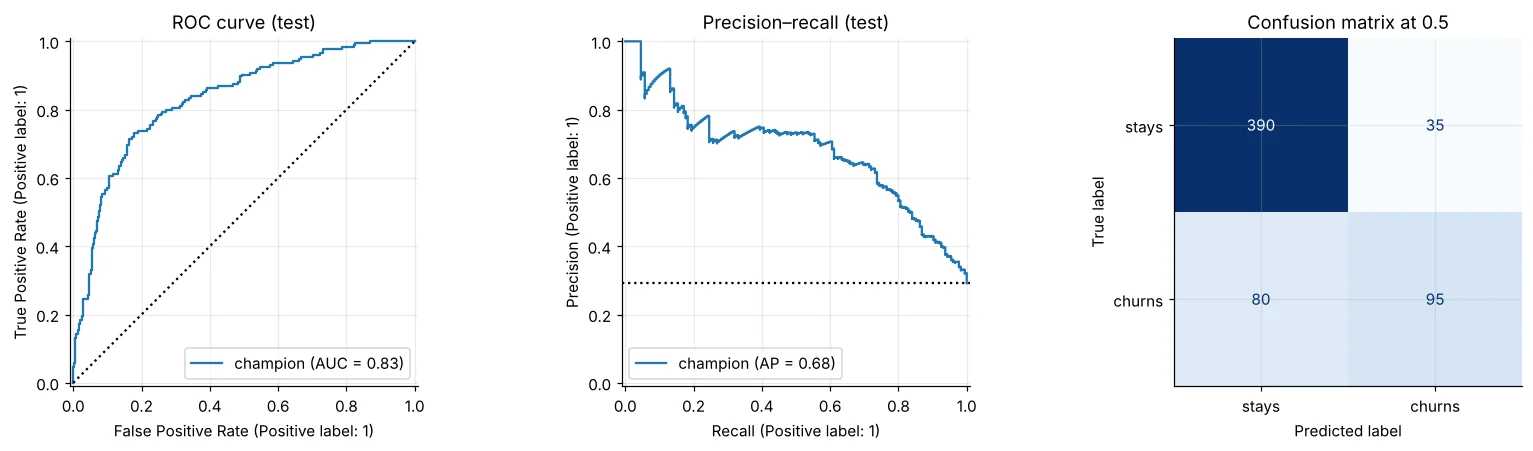
Step 2: gains and lift – what calling the top X% achieves
import numpy as np
import pandas as pd

def load_churn(path="telecom_churn.csv"):
    # "None" means no internet plan – stop pandas from turning it into NaN
    df = pd.read_csv(path, keep_default_na=False, na_values=[""])
    df["total_charges"] = df["total_charges"].fillna(df["monthly_charges"] * df["tenure_months"])
    df["churned"] = (df["churn"] == "Yes").astype(int)
    return df

def add_features(df):
    df = df.copy()
    df["tenure_band"] = pd.cut(df["tenure_months"], [0, 6, 12, 24, 48, 72], labels=["0-6", "7-12", "13-24", "25-48", "49-72"]).astype(str)
    df["is_new"] = (df["tenure_months"] <= 6).astype(int)
    df["has_complaint"] = (df["complaints"] > 0).astype(int)
    df["charge_per_gb"] = (df["monthly_charges"] / df["data_usage_gb"].clip(lower=1)).round(2)
    df["avg_monthly_paid"] = (df["total_charges"] / df["tenure_months"]).round(1)
    df["monthly_no_support"] = ((df["contract"] == "Monthly") & (df["tech_support"] == "No")).astype(int)
    return df

# original columns – the champion model uses these
NUM = ["senior_citizen", "tenure_months", "monthly_charges", "total_charges", "complaints", "data_usage_gb"]
CAT = ["gender", "contract", "internet_service", "tech_support", "payment_method"]
# original + engineered columns (tested on Day 58)
NUM_ALL = NUM + ["is_new", "has_complaint", "charge_per_gb", "avg_monthly_paid", "monthly_no_support"]
CAT_ALL = CAT + ["tenure_band"]

from sklearn.compose import ColumnTransformer
from sklearn.preprocessing import OneHotEncoder, StandardScaler
from sklearn.pipeline import Pipeline
from sklearn.linear_model import LogisticRegression
from sklearn.model_selection import train_test_split

df = add_features(load_churn())
X, y = df[NUM_ALL + CAT_ALL], df["churned"]          # keep all columns; each model picks what it needs
X_dev, X_test, y_dev, y_test = train_test_split(X, y, test_size=0.2, random_state=2025, stratify=y)

def make_model(C=0.1, num=NUM, cat=CAT):
    pre = ColumnTransformer([("num", StandardScaler(), num), ("cat", OneHotEncoder(handle_unknown="ignore"), cat)])
    return Pipeline([("prep", pre), ("clf", LogisticRegression(C=C, max_iter=5000))])

model = make_model().fit(X_dev, y_dev)                        # champion: original columns, C = 0.1
p_test = model.predict_proba(X_test)[:, 1]

import matplotlib.pyplot as plt
t = pd.DataFrame({"y": y_test.values, "p": p_test}).sort_values("p", ascending=False).reset_index(drop=True)
t["decile"] = t.index // (len(t) // 10) + 1
dec = t.groupby("decile").agg(customers=("y", "size"), churners=("y", "sum"), churn_rate=("y", "mean"))
dec["cum_capture_%"] = (dec["churners"].cumsum() / dec["churners"].sum() * 100).round(1)
dec["lift"] = (dec["churn_rate"] / t["y"].mean()).round(2)
print(dec.round(3).to_string())
fig, ax = plt.subplots(1, 2, figsize=(12, 4))
pct = np.arange(0, 101, 10)
ax[0].plot(pct, [0] + list(dec["cum_capture_%"]), marker="o", color="#4f46e5", label="model"); ax[0].plot([0, 100], [0, 100], "k:", label="random")
ax[0].set_xlabel("% of customers called (highest risk first)"); ax[0].set_ylabel("% of churners reached"); ax[0].set_title("Cumulative gains"); ax[0].legend()
ax[1].bar(dec.index, dec["lift"], color=["#dc2626" if l > 1.5 else "#94a3b8" for l in dec["lift"]]); ax[1].axhline(1, color="k", ls=":")
ax[1].set_xlabel("risk decile (1 = highest)"); ax[1].set_title("Lift per decile")
plt.tight_layout(); plt.show()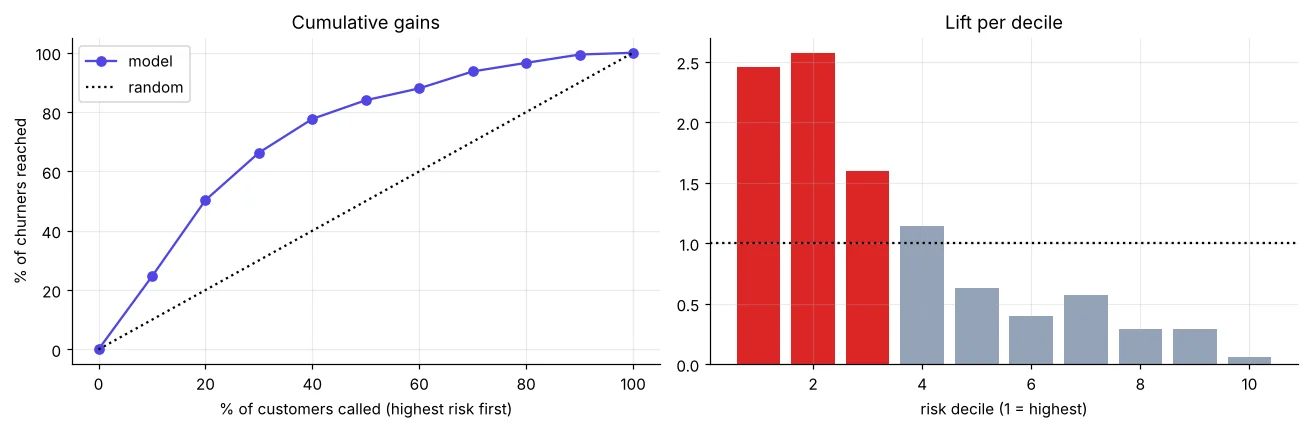
Step 3: how many customers to call? Let profit decide
Using the assumptions from Day 56: each call costs ₹40; a reached churner is saved with 30% probability and is worth one more year of their bill minus the ₹600 offer; but half of the non-churners we call also accept the discount – ₹600 wasted on people who would have stayed. We choose the list size on the development out-of-fold predictions, then confirm it on the test set.
import numpy as np
import pandas as pd

def load_churn(path="telecom_churn.csv"):
    # "None" means no internet plan – stop pandas from turning it into NaN
    df = pd.read_csv(path, keep_default_na=False, na_values=[""])
    df["total_charges"] = df["total_charges"].fillna(df["monthly_charges"] * df["tenure_months"])
    df["churned"] = (df["churn"] == "Yes").astype(int)
    return df

def add_features(df):
    df = df.copy()
    df["tenure_band"] = pd.cut(df["tenure_months"], [0, 6, 12, 24, 48, 72], labels=["0-6", "7-12", "13-24", "25-48", "49-72"]).astype(str)
    df["is_new"] = (df["tenure_months"] <= 6).astype(int)
    df["has_complaint"] = (df["complaints"] > 0).astype(int)
    df["charge_per_gb"] = (df["monthly_charges"] / df["data_usage_gb"].clip(lower=1)).round(2)
    df["avg_monthly_paid"] = (df["total_charges"] / df["tenure_months"]).round(1)
    df["monthly_no_support"] = ((df["contract"] == "Monthly") & (df["tech_support"] == "No")).astype(int)
    return df

# original columns – the champion model uses these
NUM = ["senior_citizen", "tenure_months", "monthly_charges", "total_charges", "complaints", "data_usage_gb"]
CAT = ["gender", "contract", "internet_service", "tech_support", "payment_method"]
# original + engineered columns (tested on Day 58)
NUM_ALL = NUM + ["is_new", "has_complaint", "charge_per_gb", "avg_monthly_paid", "monthly_no_support"]
CAT_ALL = CAT + ["tenure_band"]

from sklearn.compose import ColumnTransformer
from sklearn.preprocessing import OneHotEncoder, StandardScaler
from sklearn.pipeline import Pipeline
from sklearn.linear_model import LogisticRegression
from sklearn.model_selection import train_test_split

df = add_features(load_churn())
X, y = df[NUM_ALL + CAT_ALL], df["churned"]          # keep all columns; each model picks what it needs
X_dev, X_test, y_dev, y_test = train_test_split(X, y, test_size=0.2, random_state=2025, stratify=y)

def make_model(C=0.1, num=NUM, cat=CAT):
    pre = ColumnTransformer([("num", StandardScaler(), num), ("cat", OneHotEncoder(handle_unknown="ignore"), cat)])
    return Pipeline([("prep", pre), ("clf", LogisticRegression(C=C, max_iter=5000))])

import matplotlib.pyplot as plt
from sklearn.model_selection import cross_val_predict, StratifiedKFold
CALL, SAVE_RATE, OFFER, STAYER_ACCEPT = 40, 0.30, 600, 0.5
oof = cross_val_predict(make_model(), X_dev, y_dev, cv=StratifiedKFold(5, shuffle=True, random_state=0), method="predict_proba")[:, 1]
d = pd.DataFrame({"y": y_dev.values, "p": oof, "bill": X_dev["monthly_charges"].values}).sort_values("p", ascending=False)
d["value"] = (d["y"] * SAVE_RATE * (d["bill"] * 12 - OFFER)            # churner saved: one more year minus offer
              - (1 - d["y"]) * STAYER_ACCEPT * OFFER - CALL)           # stayer takes the discount anyway; every call costs ₹40
d["cum_profit"] = d["value"].cumsum()
best_n = int(d["cum_profit"].values.argmax()) + 1
share = best_n / len(d)
print(f"Most profitable list on dev: top {best_n} of {len(d)} customers ({share:.0%}), probability cut-off ≈ {d['p'].iloc[best_n - 1]:.2f}")
plt.figure(figsize=(9, 3.8))
plt.plot(np.arange(1, len(d) + 1) / len(d) * 100, d["cum_profit"] / 1e5, color="#16a34a")
plt.axvline(share * 100, color="#dc2626", ls="--", label=f"best: call top {share:.0%}"); plt.axvline(20, color="#4f46e5", ls=":", label="capacity ≈ 20%")
plt.xlabel("% of customers called"); plt.ylabel("expected net ₹ lakh"); plt.title("Expected profit curve (development data)"); plt.legend()
plt.show()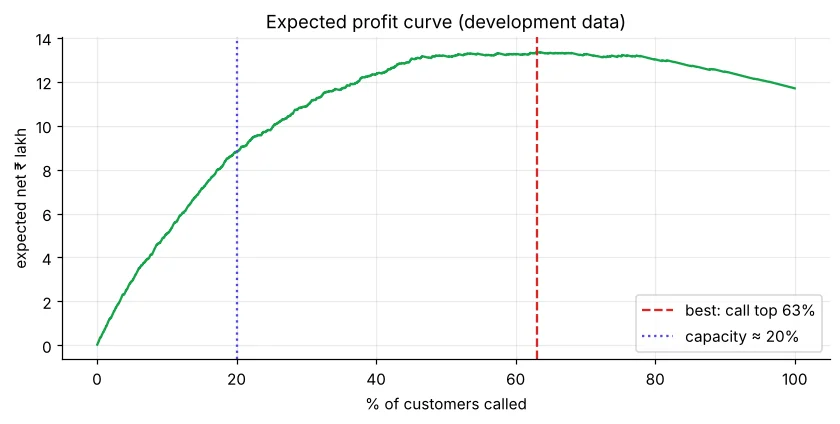
The profit-maximising list may be larger than the team can call. Then the rule is simple: call the highest-risk customers until capacity runs out – the gains chart tells you exactly what you get for that capacity. If the optimum is much larger than capacity, that is an argument to hire more agents.
import numpy as np
import pandas as pd

def load_churn(path="telecom_churn.csv"):
    # "None" means no internet plan – stop pandas from turning it into NaN
    df = pd.read_csv(path, keep_default_na=False, na_values=[""])
    df["total_charges"] = df["total_charges"].fillna(df["monthly_charges"] * df["tenure_months"])
    df["churned"] = (df["churn"] == "Yes").astype(int)
    return df

def add_features(df):
    df = df.copy()
    df["tenure_band"] = pd.cut(df["tenure_months"], [0, 6, 12, 24, 48, 72], labels=["0-6", "7-12", "13-24", "25-48", "49-72"]).astype(str)
    df["is_new"] = (df["tenure_months"] <= 6).astype(int)
    df["has_complaint"] = (df["complaints"] > 0).astype(int)
    df["charge_per_gb"] = (df["monthly_charges"] / df["data_usage_gb"].clip(lower=1)).round(2)
    df["avg_monthly_paid"] = (df["total_charges"] / df["tenure_months"]).round(1)
    df["monthly_no_support"] = ((df["contract"] == "Monthly") & (df["tech_support"] == "No")).astype(int)
    return df

# original columns – the champion model uses these
NUM = ["senior_citizen", "tenure_months", "monthly_charges", "total_charges", "complaints", "data_usage_gb"]
CAT = ["gender", "contract", "internet_service", "tech_support", "payment_method"]
# original + engineered columns (tested on Day 58)
NUM_ALL = NUM + ["is_new", "has_complaint", "charge_per_gb", "avg_monthly_paid", "monthly_no_support"]
CAT_ALL = CAT + ["tenure_band"]

from sklearn.compose import ColumnTransformer
from sklearn.preprocessing import OneHotEncoder, StandardScaler
from sklearn.pipeline import Pipeline
from sklearn.linear_model import LogisticRegression
from sklearn.model_selection import train_test_split

df = add_features(load_churn())
X, y = df[NUM_ALL + CAT_ALL], df["churned"]          # keep all columns; each model picks what it needs
X_dev, X_test, y_dev, y_test = train_test_split(X, y, test_size=0.2, random_state=2025, stratify=y)

def make_model(C=0.1, num=NUM, cat=CAT):
    pre = ColumnTransformer([("num", StandardScaler(), num), ("cat", OneHotEncoder(handle_unknown="ignore"), cat)])
    return Pipeline([("prep", pre), ("clf", LogisticRegression(C=C, max_iter=5000))])

model = make_model().fit(X_dev, y_dev)                        # champion: original columns, C = 0.1
p_test = model.predict_proba(X_test)[:, 1]

CALL, SAVE_RATE, OFFER, STAYER_ACCEPT, CAPACITY_SHARE = 40, 0.30, 600, 0.5, 0.20
t = pd.DataFrame({"y": y_test.values, "p": p_test, "bill": X_test["monthly_charges"].values}).sort_values("p", ascending=False)
k = int(len(t) * CAPACITY_SHARE)
top, rnd = t.head(k), t.sample(k, random_state=0)
def impact(g):
    saved = g["y"].sum() * SAVE_RATE
    revenue = (g["y"] * g["bill"] * 12).sum() * SAVE_RATE
    wasted = (1 - g["y"]).sum() * STAYER_ACCEPT * OFFER    # discounts given to customers who would stay
    cost = len(g) * CALL + saved * OFFER + wasted
    return g["y"].sum(), saved, revenue - cost
for name, g in [("model top 20%", top), ("random 20%", rnd)]:
    reached, saved, net = impact(g)
    print(f"{name:14s} calls {len(g)} | churners reached {reached:3d} | saved ≈ {saved:4.0f} | net ₹{net / 1e5:5.2f} lakh")
r_m, _, n_m = impact(top); r_r, _, n_r = impact(rnd)
print(f"\nModel reaches {r_m / r_r:.1f}× more churners than random calling.")
scale = 3000 / len(t)                                   # test = 20% of the customer base
print(f"Scaled to the full base each cycle: ≈ ₹{n_m * scale / 1e5:.1f} lakh net vs ₹{n_r * scale / 1e5:.1f} lakh for random calling")Step 4: can we trust the probabilities?
import numpy as np
import pandas as pd

def load_churn(path="telecom_churn.csv"):
    # "None" means no internet plan – stop pandas from turning it into NaN
    df = pd.read_csv(path, keep_default_na=False, na_values=[""])
    df["total_charges"] = df["total_charges"].fillna(df["monthly_charges"] * df["tenure_months"])
    df["churned"] = (df["churn"] == "Yes").astype(int)
    return df

def add_features(df):
    df = df.copy()
    df["tenure_band"] = pd.cut(df["tenure_months"], [0, 6, 12, 24, 48, 72], labels=["0-6", "7-12", "13-24", "25-48", "49-72"]).astype(str)
    df["is_new"] = (df["tenure_months"] <= 6).astype(int)
    df["has_complaint"] = (df["complaints"] > 0).astype(int)
    df["charge_per_gb"] = (df["monthly_charges"] / df["data_usage_gb"].clip(lower=1)).round(2)
    df["avg_monthly_paid"] = (df["total_charges"] / df["tenure_months"]).round(1)
    df["monthly_no_support"] = ((df["contract"] == "Monthly") & (df["tech_support"] == "No")).astype(int)
    return df

# original columns – the champion model uses these
NUM = ["senior_citizen", "tenure_months", "monthly_charges", "total_charges", "complaints", "data_usage_gb"]
CAT = ["gender", "contract", "internet_service", "tech_support", "payment_method"]
# original + engineered columns (tested on Day 58)
NUM_ALL = NUM + ["is_new", "has_complaint", "charge_per_gb", "avg_monthly_paid", "monthly_no_support"]
CAT_ALL = CAT + ["tenure_band"]

from sklearn.compose import ColumnTransformer
from sklearn.preprocessing import OneHotEncoder, StandardScaler
from sklearn.pipeline import Pipeline
from sklearn.linear_model import LogisticRegression
from sklearn.model_selection import train_test_split

df = add_features(load_churn())
X, y = df[NUM_ALL + CAT_ALL], df["churned"]          # keep all columns; each model picks what it needs
X_dev, X_test, y_dev, y_test = train_test_split(X, y, test_size=0.2, random_state=2025, stratify=y)

def make_model(C=0.1, num=NUM, cat=CAT):
    pre = ColumnTransformer([("num", StandardScaler(), num), ("cat", OneHotEncoder(handle_unknown="ignore"), cat)])
    return Pipeline([("prep", pre), ("clf", LogisticRegression(C=C, max_iter=5000))])

model = make_model().fit(X_dev, y_dev)                        # champion: original columns, C = 0.1
p_test = model.predict_proba(X_test)[:, 1]

import matplotlib.pyplot as plt
from sklearn.calibration import calibration_curve
frac, mean_pred = calibration_curve(y_test, p_test, n_bins=8, strategy="quantile")
plt.figure(figsize=(5.2, 4.6))
plt.plot(mean_pred, frac, marker="o", color="#4f46e5", label="champion"); plt.plot([0, 1], [0, 1], "k:", label="perfect")
plt.xlabel("predicted churn probability"); plt.ylabel("actual churn rate"); plt.title("Calibration (test set)"); plt.legend()
plt.show()
print(pd.DataFrame({"predicted": mean_pred.round(2), "actual": frac.round(2)}).to_string(index=False))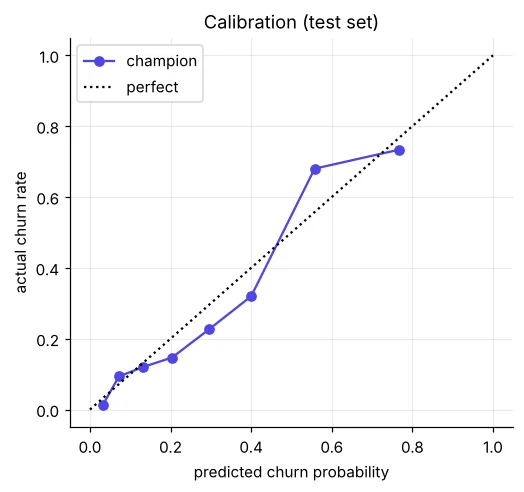
Step 5: explain the model – and each customer
import numpy as np
import pandas as pd

def load_churn(path="telecom_churn.csv"):
    # "None" means no internet plan – stop pandas from turning it into NaN
    df = pd.read_csv(path, keep_default_na=False, na_values=[""])
    df["total_charges"] = df["total_charges"].fillna(df["monthly_charges"] * df["tenure_months"])
    df["churned"] = (df["churn"] == "Yes").astype(int)
    return df

def add_features(df):
    df = df.copy()
    df["tenure_band"] = pd.cut(df["tenure_months"], [0, 6, 12, 24, 48, 72], labels=["0-6", "7-12", "13-24", "25-48", "49-72"]).astype(str)
    df["is_new"] = (df["tenure_months"] <= 6).astype(int)
    df["has_complaint"] = (df["complaints"] > 0).astype(int)
    df["charge_per_gb"] = (df["monthly_charges"] / df["data_usage_gb"].clip(lower=1)).round(2)
    df["avg_monthly_paid"] = (df["total_charges"] / df["tenure_months"]).round(1)
    df["monthly_no_support"] = ((df["contract"] == "Monthly") & (df["tech_support"] == "No")).astype(int)
    return df

# original columns – the champion model uses these
NUM = ["senior_citizen", "tenure_months", "monthly_charges", "total_charges", "complaints", "data_usage_gb"]
CAT = ["gender", "contract", "internet_service", "tech_support", "payment_method"]
# original + engineered columns (tested on Day 58)
NUM_ALL = NUM + ["is_new", "has_complaint", "charge_per_gb", "avg_monthly_paid", "monthly_no_support"]
CAT_ALL = CAT + ["tenure_band"]

from sklearn.compose import ColumnTransformer
from sklearn.preprocessing import OneHotEncoder, StandardScaler
from sklearn.pipeline import Pipeline
from sklearn.linear_model import LogisticRegression
from sklearn.model_selection import train_test_split

df = add_features(load_churn())
X, y = df[NUM_ALL + CAT_ALL], df["churned"]          # keep all columns; each model picks what it needs
X_dev, X_test, y_dev, y_test = train_test_split(X, y, test_size=0.2, random_state=2025, stratify=y)

def make_model(C=0.1, num=NUM, cat=CAT):
    pre = ColumnTransformer([("num", StandardScaler(), num), ("cat", OneHotEncoder(handle_unknown="ignore"), cat)])
    return Pipeline([("prep", pre), ("clf", LogisticRegression(C=C, max_iter=5000))])

model = make_model().fit(X_dev, y_dev)                        # champion: original columns, C = 0.1
p_test = model.predict_proba(X_test)[:, 1]

coef = pd.Series(model[-1].coef_[0], index=model[0].get_feature_names_out())
odds = np.exp(coef).round(2).sort_values()
print("Odds multipliers (per 1 SD for numbers, vs reference for categories):")
print(pd.concat([odds.head(4), odds.tail(5)]).to_string())import numpy as np
import pandas as pd
def load_churn(path="telecom_churn.csv"):
# "None" means no internet plan – stop pandas from turning it into NaN
df = pd.read_csv(path, keep_default_na=False, na_values=[""])
df["total_charges"] = df["total_charges"].fillna(df["monthly_charges"] * df["tenure_months"])
df["churned"] = (df["churn"] == "Yes").astype(int)
return df
def add_features(df):
df = df.copy()
df["tenure_band"] = pd.cut(df["tenure_months"], [0, 6, 12, 24, 48, 72], labels=["0-6", "7-12", "13-24", "25-48", "49-72"]).astype(str)
df["is_new"] = (df["tenure_months"] <= 6).astype(int)
df["has_complaint"] = (df["complaints"] > 0).astype(int)
df["charge_per_gb"] = (df["monthly_charges"] / df["data_usage_gb"].clip(lower=1)).round(2)
df["avg_monthly_paid"] = (df["total_charges"] / df["tenure_months"]).round(1)
df["monthly_no_support"] = ((df["contract"] == "Monthly") & (df["tech_support"] == "No")).astype(int)
return df
# original columns – the champion model uses these
NUM = ["senior_citizen", "tenure_months", "monthly_charges", "total_charges", "complaints", "data_usage_gb"]
CAT = ["gender", "contract", "internet_service", "tech_support", "payment_method"]
# original + engineered columns (tested on Day 58)
NUM_ALL = NUM + ["is_new", "has_complaint", "charge_per_gb", "avg_monthly_paid", "monthly_no_support"]
CAT_ALL = CAT + ["tenure_band"]
from sklearn.compose import ColumnTransformer
from sklearn.preprocessing import OneHotEncoder, StandardScaler
from sklearn.pipeline import Pipeline
from sklearn.linear_model import LogisticRegression
from sklearn.model_selection import train_test_split
df = add_features(load_churn())
X, y = df[NUM_ALL + CAT_ALL], df["churned"] # keep all columns; each model picks what it needs
X_dev, X_test, y_dev, y_test = train_test_split(X, y, test_size=0.2, random_state=2025, stratify=y)
def make_model(C=0.1, num=NUM, cat=CAT):
pre = ColumnTransformer([("num", StandardScaler(), num), ("cat", OneHotEncoder(handle_unknown="ignore"), cat)])
return Pipeline([("prep", pre), ("clf", LogisticRegression(C=C, max_iter=5000))])
model = make_model().fit(X_dev, y_dev) # champion: original columns, C = 0.1
p_test = model.predict_proba(X_test)[:, 1]
pre, clf = model[0], model[-1]
names = pre.get_feature_names_out()
Z_test = pre.transform(X_test); Z_mean = pre.transform(X_dev).mean(axis=0)
Z_test = Z_test.toarray() if hasattr(Z_test, "toarray") else Z_test
Z_mean = np.asarray(Z_mean).ravel()
def pretty(j, i):
n = names[j]
if n == "num__senior_citizen":
return "senior citizen"
if n.startswith("num__"): # say “low tenure” / “high complaints”
side = "high" if Z_test[i, j] > Z_mean[j] else "low"
return f"{side} {n[5:].replace('_', ' ')}"
return n[5:].replace("_", " = ", 1).replace("_", " ")
def reasons(i, k=3):
contrib = (Z_test[i] - Z_mean) * clf.coef_[0]
top = np.argsort(contrib)[::-1][:k]
return ", ".join(pretty(j, i) for j in top if contrib[j] > 0)
order = np.argsort(p_test)[::-1][:5]
ids = df.loc[X_test.index, "customer_id"].values
for i in order:
r = X_test.iloc[i]
print(f"{ids[i]} risk {p_test[i]:.0%} | {r.contract}, {r.tenure_months} mo, ₹{r.monthly_charges:.0f}, {r.complaints} complaints"
f"\n why: {reasons(i)}")An agent seeing “risk 92% – why: contract Monthly, tech support No, complaints” knows to open with a free tech-support offer and a yearly-plan discount, not a generic script.
Step 6: fairness and stability checks
import numpy as np
import pandas as pd

def load_churn(path="telecom_churn.csv"):
    # "None" means no internet plan – stop pandas from turning it into NaN
    df = pd.read_csv(path, keep_default_na=False, na_values=[""])
    df["total_charges"] = df["total_charges"].fillna(df["monthly_charges"] * df["tenure_months"])
    df["churned"] = (df["churn"] == "Yes").astype(int)
    return df

def add_features(df):
    df = df.copy()
    df["tenure_band"] = pd.cut(df["tenure_months"], [0, 6, 12, 24, 48, 72], labels=["0-6", "7-12", "13-24", "25-48", "49-72"]).astype(str)
    df["is_new"] = (df["tenure_months"] <= 6).astype(int)
    df["has_complaint"] = (df["complaints"] > 0).astype(int)
    df["charge_per_gb"] = (df["monthly_charges"] / df["data_usage_gb"].clip(lower=1)).round(2)
    df["avg_monthly_paid"] = (df["total_charges"] / df["tenure_months"]).round(1)
    df["monthly_no_support"] = ((df["contract"] == "Monthly") & (df["tech_support"] == "No")).astype(int)
    return df

# original columns – the champion model uses these
NUM = ["senior_citizen", "tenure_months", "monthly_charges", "total_charges", "complaints", "data_usage_gb"]
CAT = ["gender", "contract", "internet_service", "tech_support", "payment_method"]
# original + engineered columns (tested on Day 58)
NUM_ALL = NUM + ["is_new", "has_complaint", "charge_per_gb", "avg_monthly_paid", "monthly_no_support"]
CAT_ALL = CAT + ["tenure_band"]

from sklearn.compose import ColumnTransformer
from sklearn.preprocessing import OneHotEncoder, StandardScaler
from sklearn.pipeline import Pipeline
from sklearn.linear_model import LogisticRegression
from sklearn.model_selection import train_test_split

df = add_features(load_churn())
X, y = df[NUM_ALL + CAT_ALL], df["churned"]          # keep all columns; each model picks what it needs
X_dev, X_test, y_dev, y_test = train_test_split(X, y, test_size=0.2, random_state=2025, stratify=y)

def make_model(C=0.1, num=NUM, cat=CAT):
    pre = ColumnTransformer([("num", StandardScaler(), num), ("cat", OneHotEncoder(handle_unknown="ignore"), cat)])
    return Pipeline([("prep", pre), ("clf", LogisticRegression(C=C, max_iter=5000))])

model = make_model().fit(X_dev, y_dev)                        # champion: original columns, C = 0.1
p_test = model.predict_proba(X_test)[:, 1]

from sklearn.metrics import roc_auc_score
t = X_test.assign(y=y_test.values, p=p_test)
t["flagged"] = t["p"] >= np.quantile(t["p"], 0.8)
for col in ["gender", "senior_citizen", "internet_service"]:
    g = t.groupby(col).apply(lambda d: pd.Series({"customers": len(d), "actual_churn": d["y"].mean(), "flag_rate": d["flagged"].mean(),
                                                     "AUC": roc_auc_score(d["y"], d["p"]) if d["y"].nunique() > 1 else np.nan}), include_groups=False)
print(g.round(3), "\n")A model can be accurate overall and poor for one group. Here AUC is similar for women and men and flag rates follow actual churn – no group is unfairly targeted. Gender is a feature with almost no weight; you could remove it entirely for extra safety.
The evaluation summary for management
🏅 Job skills unlocked today
Practice tasks
🏋️ Practice – do it yourself
Show solution
import numpy as np
import pandas as pd

def load_churn(path="telecom_churn.csv"):
    # "None" means no internet plan – stop pandas from turning it into NaN
    df = pd.read_csv(path, keep_default_na=False, na_values=[""])
    df["total_charges"] = df["total_charges"].fillna(df["monthly_charges"] * df["tenure_months"])
    df["churned"] = (df["churn"] == "Yes").astype(int)
    return df

def add_features(df):
    df = df.copy()
    df["tenure_band"] = pd.cut(df["tenure_months"], [0, 6, 12, 24, 48, 72], labels=["0-6", "7-12", "13-24", "25-48", "49-72"]).astype(str)
    df["is_new"] = (df["tenure_months"] <= 6).astype(int)
    df["has_complaint"] = (df["complaints"] > 0).astype(int)
    df["charge_per_gb"] = (df["monthly_charges"] / df["data_usage_gb"].clip(lower=1)).round(2)
    df["avg_monthly_paid"] = (df["total_charges"] / df["tenure_months"]).round(1)
    df["monthly_no_support"] = ((df["contract"] == "Monthly") & (df["tech_support"] == "No")).astype(int)
    return df

# original columns – the champion model uses these
NUM = ["senior_citizen", "tenure_months", "monthly_charges", "total_charges", "complaints", "data_usage_gb"]
CAT = ["gender", "contract", "internet_service", "tech_support", "payment_method"]
# original + engineered columns (tested on Day 58)
NUM_ALL = NUM + ["is_new", "has_complaint", "charge_per_gb", "avg_monthly_paid", "monthly_no_support"]
CAT_ALL = CAT + ["tenure_band"]

from sklearn.compose import ColumnTransformer
from sklearn.preprocessing import OneHotEncoder, StandardScaler
from sklearn.pipeline import Pipeline
from sklearn.linear_model import LogisticRegression
from sklearn.model_selection import train_test_split

df = add_features(load_churn())
X, y = df[NUM_ALL + CAT_ALL], df["churned"]          # keep all columns; each model picks what it needs
X_dev, X_test, y_dev, y_test = train_test_split(X, y, test_size=0.2, random_state=2025, stratify=y)

def make_model(C=0.1, num=NUM, cat=CAT):
    pre = ColumnTransformer([("num", StandardScaler(), num), ("cat", OneHotEncoder(handle_unknown="ignore"), cat)])
    return Pipeline([("prep", pre), ("clf", LogisticRegression(C=C, max_iter=5000))])

model = make_model().fit(X_dev, y_dev); p = model.predict_proba(X_test)[:, 1]
t = pd.DataFrame({"y": y_test.values, "p": p, "bill": X_test["monthly_charges"].values}).sort_values("p", ascending=False).head(120)
for rate in [0.30, 0.15]:
    net = (t["y"] * rate * (t["bill"] * 12 - 600)).sum() - (1 - t["y"]).sum() * 0.5 * 600 - len(t) * 40
print(f"save-rate {rate:.0%}: net ₹{net:,.0f} per 120 calls")Quick quiz
🧠 Quick Quiz – test yourself
Interview corner
💼 Interview Corner
How did you translate model performance into business value?
I ranked customers by churn probability, built gains and lift charts, applied agreed costs (₹40 per call, 30% save-rate, ₹600 offer, one year of revenue per saved customer), chose the list size on out-of-fold predictions and confirmed on the test set that calling the top 20% reaches about twice as many churners and earns several times more than random calling.
How would you check if your model is fair?
Compare AUC, calibration and flag rates across sensitive or important groups (gender, age, region), make sure flag rates follow true risk, remove features with no legitimate business reason, and document it in the model card.
Summary
- Test performance matches CV – the model generalises.
- Gains/lift and a profit curve decide how many to call.
- Probabilities are well calibrated; groups are treated fairly.
- Each customer gets a score plus reasons for the agent.
Day 60 – the finale: retrain on all data, generate the monthly risk list, build the app and API, and present the project.
