Day 16: Dates, Times & Text Columns
✅ Today you will learn
- Parse dates and use .dt (year, month, day_name)
- Time differences with Timedelta
- resample() and rolling() on time series
- Clean and search text with .str
- Extract numbers and words with regex
🏢 In the real world
Two everyday questions: “Which weekday brings the most orders – should we run the sale on Friday or Sunday?” and “How bad was Delhi’s air in November compared with July?” Both need dates. A third – “What are customers complaining about?” – needs text.
Dates with .dt
import pandas as pd
sales = pd.read_csv("sales_data.csv", parse_dates=["order_date"])
print(sales["order_date"].dtype, sales["order_date"].min().date(), "→", sales["order_date"].max().date())
sales["month"] = sales["order_date"].dt.month
sales["month_name"] = sales["order_date"].dt.strftime("%b")
sales["weekday"] = sales["order_date"].dt.day_name()
sales["is_weekend"] = sales["order_date"].dt.dayofweek >= 5
print(sales[["order_date", "month", "month_name", "weekday", "is_weekend"]].head(3))import pandas as pd
sales = pd.read_csv("sales_data.csv", parse_dates=["order_date"])
order = ["Monday", "Tuesday", "Wednesday", "Thursday", "Friday", "Saturday", "Sunday"]
by_day = sales["order_date"].dt.day_name().value_counts().reindex(order)
print(by_day)
print("Best day:", by_day.idxmax())import pandas as pd
sales = pd.read_csv("sales_data.csv", parse_dates=["order_date"])
sales["festive"] = sales["order_date"].between("2024-10-01", "2024-11-15")
sales["revenue"] = sales["quantity"] * sales["unit_price"] * (1 - sales["discount"])
days = {True: 46, False: 366 - 46}
per_day = sales.groupby("festive")["revenue"].sum() / pd.Series(days)
print(per_day.round())
print("Festive days earn", round(per_day[True] / per_day[False], 1), "x a normal day")Date arithmetic
import pandas as pd
emp = pd.read_csv("employees.csv", parse_dates=["join_date"])
today = pd.Timestamp("2025-01-01")
emp["tenure_days"] = (today - emp["join_date"]).dt.days
emp["tenure_years"] = (emp["tenure_days"] / 365.25).round(1)
emp["review_due"] = emp["join_date"] + pd.DateOffset(years=5)
print(emp[["name", "join_date", "tenure_years", "review_due"]].head(4))
print("Average tenure:", emp["tenure_years"].mean().round(1), "years")resample and rolling: time-series views
import pandas as pd
w = pd.read_csv("delhi_weather.csv", parse_dates=["date"]).set_index("date")
monthly = w["aqi"].resample("ME").mean().round()
print(monthly["2024"].to_string())
print("Worst month:", monthly.idxmax().strftime("%b %Y"), "AQI", int(monthly.max()))import pandas as pd
import matplotlib.pyplot as plt
w = pd.read_csv("delhi_weather.csv", parse_dates=["date"]).set_index("date")
fig, ax = plt.subplots(figsize=(10, 4.2))
ax.plot(w.index, w["aqi"], color="#cbd5e1", lw=0.8, label="Daily AQI")
ax.plot(w.index, w["aqi"].rolling(30).mean(), color="#dc2626", lw=2.2, label="30-day average")
ax.axhline(200, color="#f59e0b", ls="--", lw=1, label="Poor (200)")
ax.set_title("Delhi air quality 2022–2024: every winter is a crisis")
ax.set_ylabel("AQI"); ax.legend()
plt.show()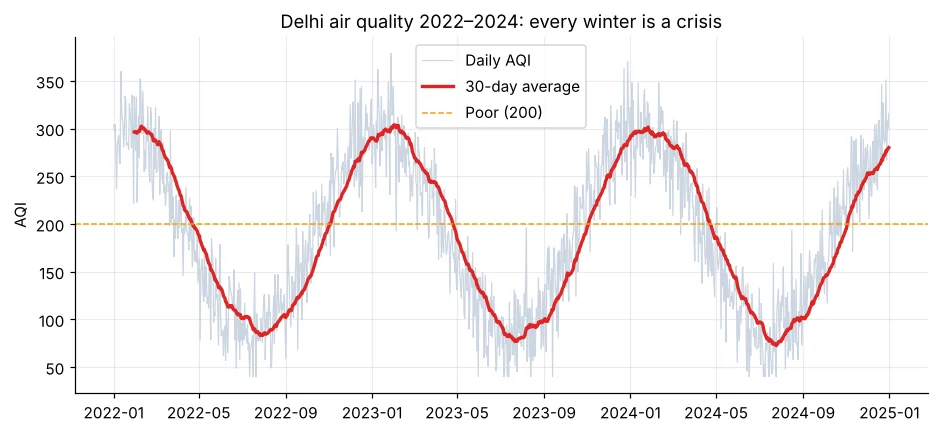
| Code | Meaning |
|---|---|
| "D" / "W" | day / week |
| "ME" / "MS" | month end / month start |
| "QE" | quarter end |
| "YE" | year end |
Text with .str
import pandas as pd
rv = pd.read_csv("product_reviews.csv")
print(rv.head(3))
rv["clean"] = rv["review"].str.lower().str.replace(r"[^a-z ]", "", regex=True).str.strip()
rv["words"] = rv["clean"].str.split().str.len()
print(rv[["clean", "words"]].head(3))
print("Average words per review:", rv["words"].mean().round(1))import pandas as pd
rv = pd.read_csv("product_reviews.csv")
text = rv["review"].str.lower()
topics = {"delivery": "deliver|late|courier", "quality": "quality|broke|stopped|faded|cheap",
"size": "size|fit|small|tight", "refund": "refund|return|replace"}
for name, pat in topics.items():
hits = text.str.contains(pat)
print(f"{name:9s} mentioned in {hits.sum():3d} reviews | avg stars {rv.loc[hits, 'stars'].mean():.2f}")import pandas as pd
s = pd.Series(["Order #4521 delivered in 3 days", "Refund of Rs 1,299 for order #4610", "Call 98765-43210 for help"])
print(s.str.extract(r"#(\d+)"))
print(s.str.findall(r"\d+").tolist())
print(s.str.startswith("Order").tolist())Reviews about size and refunds average under 2 stars – far worse than delivery (about 3.1). So the first fix is a better size chart and a faster refund process, not a new courier. Text analysis turns 600 reviews into a priority list in seconds.
🏅 Job skills unlocked today
Practice tasks
🏋️ Practice – do it yourself
Show solution
import pandas as pd
w = pd.read_csv("delhi_weather.csv", parse_dates=["date"])
print(w.groupby(w["date"].dt.month)["avg_temp_c"].mean().round(1).to_string())Show solution
import pandas as pd
s = pd.read_csv("sales_data.csv", parse_dates=["order_date"])
s["day_type"] = s["order_date"].dt.dayofweek.map(lambda d: "Weekend" if d >= 5 else "Weekday")
print(pd.crosstab(s["category"], s["day_type"]))Show solution
import pandas as pd
rv = pd.read_csv("product_reviews.csv")
words = rv.loc[rv["sentiment"] == "negative", "review"].str.lower().str.findall(r"[a-z]{4,}").explode()
print(words.value_counts().head(10))Quick quiz
🧠 Quick Quiz – test yourself
Interview corner
💼 Interview Corner
How would you find seasonality in daily sales?
Convert the date column, set it as index, resample to weekly/monthly totals, plot with a rolling mean, and compare the same month across years or group by month/weekday. Later, decomposition (Day 49) separates trend and seasonality formally.
Why use vectorised .str methods instead of a Python loop?
They are shorter, handle NaN safely and are usually faster. A loop over rows with if-statements is harder to read and easy to break.
Summary
- parse_dates / to_datetime → use .dt.month, .dt.day_name(), .dt.quarter.
- Date minus date = Timedelta; DateOffset adds months/years.
- resample("ME") for periods, rolling(n) for moving averages.
- .str.lower/strip/replace/contains/extract for text, with regex.
Day 17: create new features with apply, map, np.where, cut and qcut – turning raw columns into business signals.
