Day 56: Project 1: Business Problem & Data
✅ Today you will learn
- Understand why churn costs a telecom company crores
- Turn a business goal into an ML problem
- Audit the data and catch hidden traps
- Measure the baseline: churn rate and revenue at risk
- Write the project charter and success metrics
🏢 In the real world
TeleOne, a mid-size Indian telecom and broadband provider, is losing almost 3 of every 10 customers a year. Getting a new customer costs about five times more than keeping one. The Head of Retention asks you: “Every month, give my team a list of customers who are about to leave and tell us why – so we call the right people with the right offer.” Over the next five days you will deliver exactly that, end to end.
The 5-day project plan
- 1Day 56 – business problem, data audit, baseline
- 2Day 57 – EDA, statistical tests, insights
- 3Day 58 – features, pipelines, model comparison
- 4Day 59 – evaluation, threshold, ₹ impact, explanations
- 5Day 60 – deployment, risk list, report and presentation
Step 1: understand the business
Step 2: frame it as an ML problem
| Question | Answer for this project |
|---|---|
| Target (y) | churn = Yes / No → binary classification |
| Unit | One row = one customer |
| Prediction moment | Start of each month, using data known on that day |
| Output | Probability of churn + top reasons per customer |
| Who uses it | Retention call-centre team (≈ 600 calls/month capacity) |
| Main metric | ROC-AUC + recall in the top 20% riskiest customers |
| Business metric | Net ₹ saved = revenue retained − offer cost |
Ask for each column: “Is this known before the customer decides to leave?” Columns like “cancellation_reason” or “final_bill_date” would be leakage. In our data all columns describe the customer before churn – but always ask.
Step 3: audit the data
import pandas as pd
raw = pd.read_csv("telecom_churn.csv")
print(raw.shape)
print(raw.dtypes.astype(str).to_dict())
print("Missing values:\n", raw.isna().sum()[raw.isna().sum() > 0])
print("internet_service values:", raw["internet_service"].value_counts(dropna=False).to_dict())625 customers seem to have a missing internet service – but they are not missing! Their value is the text “None” (no internet plan), and pandas converts “None” to NaN by default. Dropping or filling them blindly would corrupt 21% of the data.
import numpy as np
import pandas as pd

def load_churn(path="telecom_churn.csv"):
    # "None" means no internet plan – stop pandas from turning it into NaN
    df = pd.read_csv(path, keep_default_na=False, na_values=[""])
    df["total_charges"] = df["total_charges"].fillna(df["monthly_charges"] * df["tenure_months"])
    df["churned"] = (df["churn"] == "Yes").astype(int)
    return df

df = load_churn()
print(df["internet_service"].value_counts().to_dict())
print("Missing after load:", int(df.isna().sum().sum()))
print("Duplicates:", df["customer_id"].duplicated().sum())
check = (df["tech_support"] == "No internet") == (df["internet_service"] == "None")
print("tech_support consistent with internet_service:", bool(check.all()))import numpy as np
import pandas as pd
def load_churn(path="telecom_churn.csv"):
# "None" means no internet plan – stop pandas from turning it into NaN
df = pd.read_csv(path, keep_default_na=False, na_values=[""])
df["total_charges"] = df["total_charges"].fillna(df["monthly_charges"] * df["tenure_months"])
df["churned"] = (df["churn"] == "Yes").astype(int)
return df
df = load_churn()
rules = {"tenure 1–72 months": df["tenure_months"].between(1, 72).all(),
"monthly charges > 0": (df["monthly_charges"] > 0).all(),
"total ≈ monthly × tenure": (abs(df["total_charges"] - df["monthly_charges"] * df["tenure_months"]) / df["total_charges"] < 0.06).mean() > 0.95,
"complaints ≥ 0": (df["complaints"] >= 0).all(),
"churn only Yes/No": set(df["churn"]) == {"Yes", "No"}}
for rule, ok in rules.items():
print(("✅" if ok else "❌"), rule)Data dictionary
| Column | Type | Meaning |
|---|---|---|
| customer_id | id | Unique customer code |
| gender, senior_citizen | category / 0-1 | Demographics |
| tenure_months | number | Months with TeleOne (1–72) |
| contract | category | Monthly / One year / Two year |
| internet_service | category | Fiber / DSL / None |
| tech_support | category | Yes / No / No internet |
| payment_method | category | UPI AutoPay / Credit Card / Bank Transfer / Cash |
| monthly_charges, total_charges | ₹ | Current bill and lifetime spend |
| complaints | count | Complaints in the last 6 months |
| data_usage_gb | number | Average monthly data |
| churn | target | Yes = left |
Step 4: measure the baseline
import numpy as np
import pandas as pd

def load_churn(path="telecom_churn.csv"):
    # "None" means no internet plan – stop pandas from turning it into NaN
    df = pd.read_csv(path, keep_default_na=False, na_values=[""])
    df["total_charges"] = df["total_charges"].fillna(df["monthly_charges"] * df["tenure_months"])
    df["churned"] = (df["churn"] == "Yes").astype(int)
    return df

df = load_churn()
churners = df[df["churned"] == 1]
rate = df["churned"].mean()
monthly_lost = churners["monthly_charges"].sum()
print(f"Customers: {len(df):,} | churned: {len(churners):,} | churn rate: {rate:.1%}")
print(f"Monthly revenue walking out: ₹{monthly_lost:,.0f}  → per year ≈ ₹{monthly_lost * 12 / 1e5:.1f} lakh")
print(f"Average bill – churners ₹{churners['monthly_charges'].mean():.0f} vs stayers ₹{df.loc[df['churned'] == 0, 'monthly_charges'].mean():.0f}")import numpy as np
import pandas as pd
def load_churn(path="telecom_churn.csv"):
# "None" means no internet plan – stop pandas from turning it into NaN
df = pd.read_csv(path, keep_default_na=False, na_values=[""])
df["total_charges"] = df["total_charges"].fillna(df["monthly_charges"] * df["tenure_months"])
df["churned"] = (df["churn"] == "Yes").astype(int)
return df
import matplotlib.pyplot as plt
df = load_churn()
fig, ax = plt.subplots(1, 2, figsize=(11, 3.8))
c = df["churn"].value_counts()
ax[0].pie(c, labels=[f"{k} ({v:,})" for k, v in c.items()], colors=["#94a3b8", "#dc2626"], autopct="%1.1f%%", startangle=90, wedgeprops=dict(width=0.45))
ax[0].set_title("29% of customers churned")
rev = df.groupby("churn")["monthly_charges"].sum() / 1e5
ax[1].bar(rev.index, rev.values, color=["#94a3b8", "#dc2626"]); ax[1].set_ylabel("₹ lakh per month")
ax[1].set_title("Monthly revenue: kept vs walked out")
for i, v in enumerate(rev.values): ax[1].text(i, v + 0.2, f"₹{v:.1f} L", ha="center")
plt.tight_layout(); plt.show()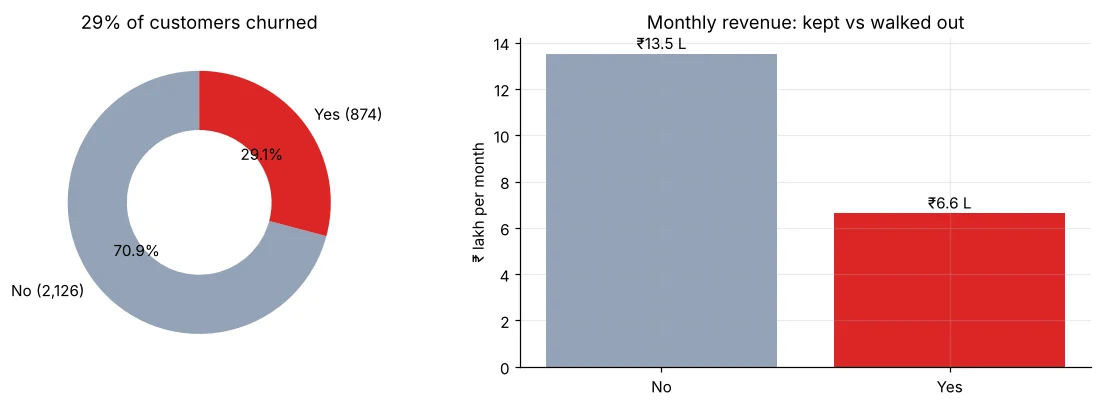
Step 5: business assumptions (agreed with the retention team)
assumptions = {
    "retention offer": "₹100 off per month for 6 months",
    "offer cost per accepted customer (₹)": 600,
    "call cost per customer contacted (₹)": 40,
    "share of true churners saved by a call + offer": 0.30,
    "share of non-churners who still take the offer": 0.50,
    "value of a saved customer (₹)": "monthly bill × 12 (one more year)",
    "call capacity per month": 600,
}
for k, v in assumptions.items():
    print(f"{k:48s} {v}")
saved_value = 759 * 12            # average churner bill ≈ ₹759 (Step 4)
print(f"\nOne saved churner ≈ ₹{saved_value:,} of revenue; cost of trying = ₹40 call (+ ₹600 if they accept)")On Day 59 we turn model output into rupees. Agreeing on the cost of a call, the offer and the save-rate before modelling keeps the evaluation honest and lets the business change a number later without redoing the work.
Step 6: the project charter
# TeleOne Churn Prediction – Project Charter
**Goal:** Reduce customer churn by targeting retention calls at customers most likely to leave.
**Users:** Retention team (600 calls / month).
**Deliverables:** (1) monthly risk list with top reasons, (2) Streamlit app for agents,
(3) model card and one-page report.
**Success metrics:** ROC-AUC ≥ 0.80 on unseen customers; ≥ 2× more churners reached
per call than random calling; positive net ₹ impact under agreed assumptions.
**Data:** 3,000 customers, 13 columns, snapshot at month start. No leakage columns.
**Risks:** small dataset; offer acceptance rate is an assumption → propose an A/B pilot.
**Timeline:** Day 56 problem & data · 57 EDA · 58 models · 59 evaluation · 60 deployment.
🏅 Job skills unlocked today
Practice tasks
🏋️ Practice – do it yourself
Show solution
import numpy as np
import pandas as pd

def load_churn(path="telecom_churn.csv"):
    # "None" means no internet plan – stop pandas from turning it into NaN
    df = pd.read_csv(path, keep_default_na=False, na_values=[""])
    df["total_charges"] = df["total_charges"].fillna(df["monthly_charges"] * df["tenure_months"])
    df["churned"] = (df["churn"] == "Yes").astype(int)
    return df

df = load_churn()
print(f"Random 600 calls reach ≈ {600 * df['churned'].mean():.0f} churners (the number our model must beat)")Show solution
import numpy as np
import pandas as pd

def load_churn(path="telecom_churn.csv"):
    # "None" means no internet plan – stop pandas from turning it into NaN
    df = pd.read_csv(path, keep_default_na=False, na_values=[""])
    df["total_charges"] = df["total_charges"].fillna(df["monthly_charges"] * df["tenure_months"])
    df["churned"] = (df["churn"] == "Yes").astype(int)
    return df

df = load_churn()
print(df[df["churned"] == 1].groupby("internet_service")["monthly_charges"].sum().sort_values(ascending=False))Quick quiz
🧠 Quick Quiz – test yourself
Interview corner
💼 Interview Corner
How would you frame a churn prediction problem?
Define churn and the observation window, the prediction moment and horizon, the unit (customer), allowed features (known before churn), the action (retention offers with limited capacity), and success metrics both statistical (AUC, recall@capacity) and business (net savings).
What data-quality checks do you run first?
Shape and types, missing values (and how they are encoded!), duplicates on the key, valid ranges, cross-column consistency (total ≈ monthly × tenure), target values and class balance.
Summary
- Business first: churn costs revenue; the action is targeted retention calls.
- ML framing: binary target, prediction moment, no leakage, capacity-aware metrics.
- Audit found a silent “None” → NaN trap – fixed in load_churn().
- Baseline: 29% churn; random calls reach ~175 churners out of 600.
Day 57: EDA – find who churns and why, test the patterns statistically and write the first insights.
