Day 1: What is Data Science? Jobs & Roadmap
✅ Today you will learn
- What data science really means
- Where it is used in India – UPI, Swiggy, cricket, hospitals
- Job roles: Analyst, Scientist, ML Engineer, Data Engineer
- The 6-step data science life cycle
- Your 60-day plan and how to study it
🏢 In the real world
Every time you order on Swiggy, the app predicts delivery time from distance, traffic, rain and restaurant speed. A data scientist built that model from millions of past orders. By Day 60 you will build a model like that yourself.
What is data science?
Data science is the skill of turning raw data into useful decisions. It mixes three things: programming (Python, SQL) to handle data, statistics to understand it, and business sense to ask the right questions.
Real examples around you
| Company / field | Question asked | Data used | Result |
|---|---|---|---|
| UPI / banks | Is this payment a fraud? | Amount, time, location, device | Suspicious payments blocked in milliseconds |
| Swiggy / Zomato | How long will delivery take? | Distance, traffic, weather, past orders | Accurate ETA on your screen |
| Flipkart / Amazon | What will this customer buy next? | Clicks, cart, past purchases | “You may also like” recommendations |
| IPL teams | Which player suits this pitch? | Ball-by-ball match data | Better team selection and strategy |
| Hospitals | Which patient is at high risk? | Reports, age, vitals | Early treatment, lives saved |
| Weather (IMD) | Will it rain tomorrow? | Satellite and sensor readings | Forecasts for farmers and airports |
A first taste of Python
Don't worry about understanding every word yet. This is a real retail dataset (2,000 orders of an Indian online store, used throughout this course). In a few lines we find which category earns the most money. By Day 19 you will write analyses like this on your own.
import pandas as pd
sales = pd.read_csv("sales_data.csv")
sales["revenue"] = sales["quantity"] * sales["unit_price"] * (1 - sales["discount"])
by_cat = sales.groupby("category")["revenue"].sum()
print(by_cat.sort_values(ascending=False).round())import pandas as pd
import matplotlib.pyplot as plt
sales = pd.read_csv("sales_data.csv")
sales["revenue"] = sales["quantity"] * sales["unit_price"] * (1 - sales["discount"])
month = sales["order_date"].str[:7] # "2024-01"
monthly = sales.groupby(month)["revenue"].sum() / 100000
monthly.plot(marker="o", color="#4f46e5")
plt.title("BazaarKart monthly revenue 2024 (₹ lakh)")
plt.xlabel("Month"); plt.ylabel("Revenue (₹ lakh)")
plt.xticks(rotation=45)
plt.show()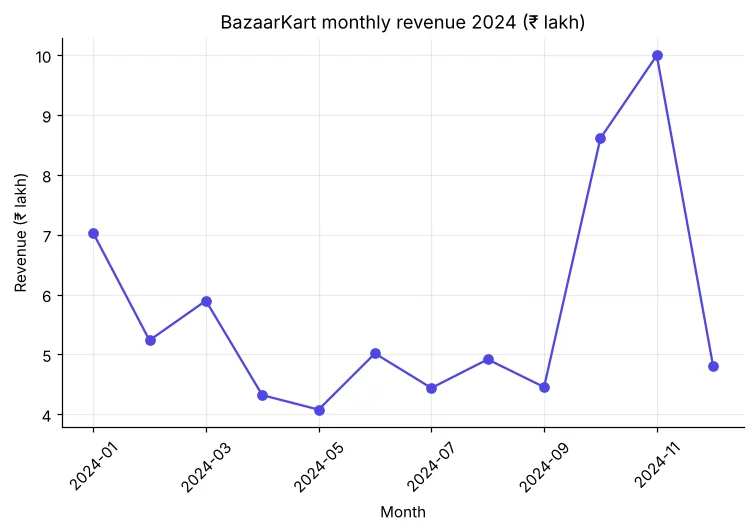
Data → chart → insight → decision: “Stock more electronics before October and run ads in the first week of November.” That last step – the decision – is why companies pay data scientists.
Job roles in data
Pay depends a lot on city, company and your portfolio. Instead of trusting a single number from the internet, search the role and your city on Naukri, LinkedIn Jobs or Glassdoor and note the ranges you see. A strong project portfolio (you will build several here) matters more than certificates.
The data science life cycle
- 1Ask – define the business question (e.g. “Why are customers leaving?”)
- 2Collect – get data from databases, CSV/Excel, APIs, surveys
- 3Clean – fix missing values, duplicates, wrong types (often 60–70% of the work)
- 4Explore – charts and statistics to find patterns (EDA)
- 5Model – build a machine learning model to predict
- 6Communicate & deploy – dashboards, reports, an app the business can use
Tools you will master
| Tool | Used for | Days |
|---|---|---|
| Python | The main language of data science | 2–7 |
| NumPy, Pandas | Fast maths and table handling | 8–20 |
| Matplotlib, Seaborn, Plotly | Charts and dashboards | 21–25 |
| Statistics (SciPy) | Testing ideas with data | 26–31 |
| SQL (SQLite) | Getting data from databases | 32–35 |
| scikit-learn | Machine learning models | 36–50 |
| Streamlit / Flask | Turning a model into an app | 50, 60 |
| Git & GitHub | Showing your work to employers | 53 |
Your 60-day roadmap
How to study this course
- Give 1.5–2 hours a day. Missing a day is fine – just continue the next day.
- Type every program yourself in Jupyter or Colab. Copy-paste teaches nothing.
- Do the practice tasks before opening the solution.
- Take the quiz at the end of each day; revise if you score below 4/5.
- Download the datasets once (Day 2) – every lesson uses the same files.
- Keep a notebook of “insights” – this becomes your interview story.
🏅 Job skills unlocked today
Practice tasks
🏋️ Practice – do it yourself
Quick quiz
🧠 Quick Quiz – test yourself
Interview corner
💼 Interview Corner
What is the difference between a data analyst and a data scientist?
An analyst mostly explains the past – what happened and why – using SQL, Excel, Python and dashboards. A data scientist also predicts the future using statistics and machine learning models. In small companies one person often does both.
Explain the data science life cycle.
Ask the business question, collect data, clean it, explore it with charts and statistics, build and evaluate a model, then communicate and deploy the result so the business can use it – and monitor it over time.
Summary
- Data science turns data into decisions using programming, statistics and domain knowledge.
- It powers UPI fraud checks, delivery times, recommendations, sports and health care.
- Main roles: Data Analyst, Data Scientist, ML Engineer, Data Engineer, Business Analyst.
- Life cycle: Ask → Collect → Clean → Explore → Model → Communicate & deploy.
Day 2: install Python, Jupyter and Google Colab, download the course datasets and run your first notebook.
