दिन 49: Time Series और Forecasting
✅ आज आप सीखेंगे
- Time-series data ख़ास क्यों है
- Trend, seasonality और decomposition
- Baselines: naive और seasonal-naive
- Lag और calendar features के साथ ML forecasting
- Holt-Winters और समय-आधारित validation
🏢 असली दुनिया में
Delhi के schools और hospitals छुट्टियाँ, masks और extra staff plan करने के लिए 30 दिन का air-quality अनुमान चाहते हैं। Retailers अगले महीने की demand, banks अगले हफ़्ते की cash निकासी। ये सब forecasting समस्याएँ हैं – और नियम सामान्य ML से अलग हैं क्योंकि भविष्य कभी अतीत में leak नहीं होना चाहिए।
Series देखें
import pandas as pd
import matplotlib.pyplot as plt
w = pd.read_csv("delhi_weather.csv", parse_dates=["date"]).set_index("date").asfreq("D")
print(w.shape, "| missing days:", w["aqi"].isna().sum())
m = w["aqi"].resample("MS").mean()
fig, ax = plt.subplots(figsize=(10, 3.6))
ax.plot(w.index, w["aqi"], color="#cbd5e1", lw=0.7, label="daily")
ax.plot(m.index, m.values, color="#dc2626", marker="o", lw=2, label="monthly mean")
ax.set_title("Delhi AQI 2022–2024: strong yearly seasonality"); ax.legend(); plt.show()
Trend + seasonality + noise
import pandas as pd
import matplotlib.pyplot as plt
from statsmodels.tsa.seasonal import seasonal_decompose
w = pd.read_csv("delhi_weather.csv", parse_dates=["date"]).set_index("date")
weekly = w["aqi"].resample("W").mean()
dec = seasonal_decompose(weekly, model="additive", period=52)
fig = dec.plot(); fig.set_size_inches(10, 6.5); fig.suptitle("Decomposition of weekly AQI", y=1.01)
plt.tight_layout(); plt.show()
print("seasonal swing (max − min):", round(dec.seasonal.max() - dec.seasonal.min()), "AQI points")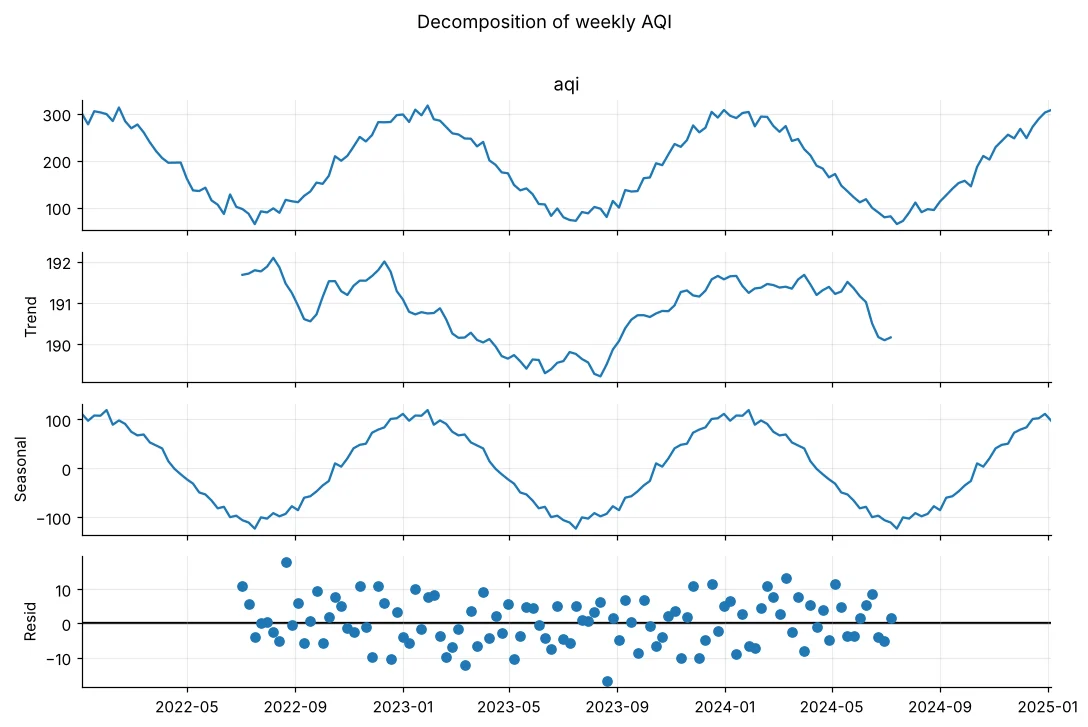
समय से split करें, कभी random नहीं
import pandas as pd
w = pd.read_csv("delhi_weather.csv", parse_dates=["date"]).set_index("date")
train, test = w.loc[:"2023-12-31", "aqi"], w.loc["2024-01-01":, "aqi"]
print("train:", train.index.min().date(), "→", train.index.max().date(), len(train))
print("test :", test.index.min().date(), "→", test.index.max().date(), len(test))train_test_split से model 15 March से सीखकर 14 March predict कर सकता है – असल ज़िंदगी में असंभव। हमेशा अतीत पर train और भविष्य पर test करें (या TimeSeriesSplit लें)।
पहले baselines
import numpy as np
import pandas as pd
from sklearn.metrics import mean_absolute_error, mean_absolute_percentage_error
w = pd.read_csv("delhi_weather.csv", parse_dates=["date"]).set_index("date")["aqi"]
test = w.loc["2024"]
preds = {"naive (last value of 2023)": pd.Series(w.loc["2023-12-31"], index=test.index),
         "mean of 2022–23": pd.Series(w.loc[:"2023"].mean(), index=test.index),
         "seasonal naive (same day last year)": w.shift(365).loc["2024"]}
for name, p in preds.items():
print(f"{name:36s} MAE {mean_absolute_error(test, p):6.1f} MAPE {mean_absolute_percentage_error(test, p) * 100:5.1f}%")Mean absolute percentage error: “औसतन हम 18% ग़लत हैं”। Managers के लिए आसान, पर असली values शून्य के पास हों (0 units sales) तो अस्थिर।
Lag features के साथ machine learning
import numpy as np
import pandas as pd
from sklearn.ensemble import HistGradientBoostingRegressor
from sklearn.metrics import mean_absolute_error
w = pd.read_csv("delhi_weather.csv", parse_dates=["date"]).set_index("date")
f = pd.DataFrame(index=w.index)
f["aqi"] = w["aqi"]
f["lag_365"] = w["aqi"].shift(365)                   # same day last year
f["lag_30"] = w["aqi"].shift(30)                     # a month ago (known 30 days ahead)
f["roll_30_lag_30"] = w["aqi"].shift(30).rolling(30).mean()
f["doy_sin"] = np.sin(2 * np.pi * w.index.dayofyear / 365.25)
f["doy_cos"] = np.cos(2 * np.pi * w.index.dayofyear / 365.25)
f["weekday"] = w.index.dayofweek
f = f.dropna()
tr, te = f.loc[:"2023"], f.loc["2024"]
feats = [c for c in f.columns if c != "aqi"]
model = HistGradientBoostingRegressor(max_iter=300, learning_rate=0.05, random_state=0).fit(tr[feats], tr["aqi"])
pred = pd.Series(model.predict(te[feats]), index=te.index)
print("training rows:", len(tr), "| features:", feats)
print(f"ML forecast MAE {mean_absolute_error(te['aqi'], pred):.1f}")
pred.to_frame("pred").assign(actual=te["aqi"]).to_csv("aqi_forecast_2024.csv")30 दिन आगे के forecast में कल का AQI उपलब्ध नहीं – इसलिए सबसे छोटा lag 30 दिन। Lags को forecast horizon से मिलाना leakage से बचने का time-series रूप है।
Holt-Winters exponential smoothing
import pandas as pd
import matplotlib.pyplot as plt
from statsmodels.tsa.holtwinters import ExponentialSmoothing
from sklearn.metrics import mean_absolute_error
w = pd.read_csv("delhi_weather.csv", parse_dates=["date"]).set_index("date")["aqi"]
monthly = w.resample("MS").mean()
train, test = monthly.loc[:"2023"], monthly.loc["2024"]
hw = ExponentialSmoothing(train, trend=None, seasonal="additive", seasonal_periods=12).fit()
fc = hw.forecast(12)
snaive = monthly.shift(12).loc["2024"]
print(f"monthly MAE → Holt-Winters {mean_absolute_error(test, fc):.1f} | seasonal naive {mean_absolute_error(test, snaive):.1f}")
plt.figure(figsize=(10, 3.8))
plt.plot(monthly.index, monthly, color="#64748b", marker="o", label="actual")
plt.plot(fc.index, fc, color="#dc2626", marker="o", ls="--", label="Holt-Winters forecast 2024")
plt.axvspan(test.index.min(), test.index.max(), color="#fee2e2", alpha=0.5)
plt.title("Forecasting 2024 monthly AQI from 2022–23 only"); plt.legend(); plt.show()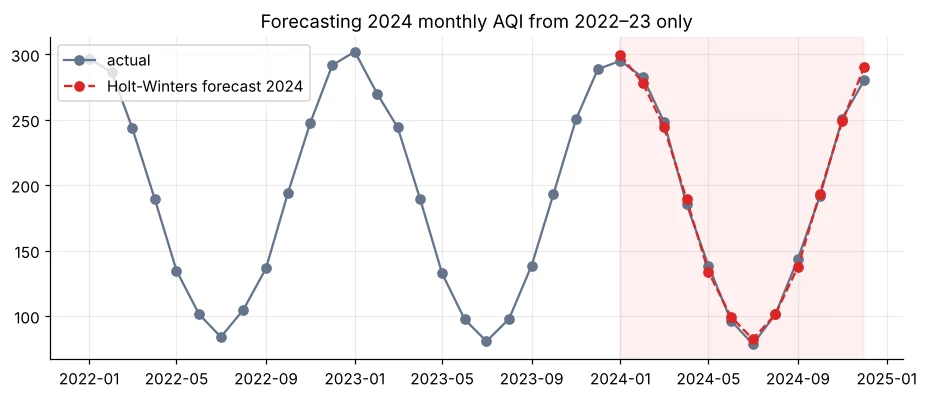
Time-series cross-validation
import numpy as np
from sklearn.model_selection import TimeSeriesSplit
idx = np.arange(12)
for i, (tr, te) in enumerate(TimeSeriesSplit(n_splits=4, test_size=2).split(idx), 1):
print(f"fold {i}: train months {tr.min()}–{tr.max()} → test months {te.tolist()}")| Method | किसके लिए अच्छा |
|---|---|
| Seasonal naive | हमेशा – हराने वाली baseline |
| Holt-Winters / ETS | साफ़ trend + seasonality, कम series |
| ARIMA / SARIMA | Classic statistical forecasting, short-term |
| Prophet | Holidays (Diwali!) वाली business series, आसान |
| ML with lags (boosting) | कई जुड़ी series, weather, promotions जैसे extra features |
🏅 आज के Job Skills
Practice tasks
🏋️ Practice – ख़ुद करें
Solution देखें
import pandas as pd
from statsmodels.tsa.holtwinters import ExponentialSmoothing
from sklearn.metrics import mean_absolute_error
t = pd.read_csv("delhi_weather.csv", parse_dates=["date"]).set_index("date")["avg_temp_c"].resample("MS").mean()
fc = ExponentialSmoothing(t.loc[:"2023"], seasonal="additive", seasonal_periods=12).fit().forecast(12)
print("HW", round(mean_absolute_error(t.loc["2024"], fc), 2), "| seasonal naive", round(mean_absolute_error(t.loc["2024"], t.shift(12).loc["2024"]), 2))Solution देखें
import pandas as pd
s = pd.read_csv("sales_data.csv", parse_dates=["order_date"]); s["rev"] = s["quantity"] * s["unit_price"] * (1 - s["discount"])
wk = s.set_index("order_date")["rev"].resample("W").sum()
ma = wk.shift(1).rolling(4).mean()
print(pd.DataFrame({"actual": wk, "moving_avg_forecast": ma}).tail(8).round(0))Quick quiz
🧠 Quick Quiz – ख़ुद को जाँचें
Interview corner
💼 Interview Corner
Time-series validation कैसे अलग है?
Data समय से split होना चाहिए – पहले के periods पर train, बाद के पर test – expanding या rolling windows (TimeSeriesSplit) से। Features सिर्फ़ forecast के समय उपलब्ध जानकारी लें।
Forecasting के लिए कौन सी baselines लेते हैं?
Naive (आख़िरी value), seasonal naive (पिछले season का वही period) और moving average। Complex model तभी काम का है जब इन्हें साफ़ हराए।
सारांश
- Time series = trend + seasonality + noise।
- समय से split करें; naive और seasonal-naive baselines को हराएँ।
- Horizon से मिले lags + calendar features वाला ML अच्छा काम करता है।
- Holt-Winters मज़बूत सरल seasonal model है; MAE और MAPE बताएँ।
Day 50: अपना model deploy करें – joblib से save करें और Streamlit व Flask से predictions दें।
