दिन 27: Data Science के लिए Probability
✅ आज आप सीखेंगे
- Probability = लंबे समय की frequency
- AND, OR और NOT नियम
- Crosstab से conditional probability
- Bayes theorem: tests, spam, fraud
- Business फ़ैसलों के लिए expected value
🏢 असली दुनिया में
एक fraud system UPI payment को flag करता है। यह 99% fraud पकड़ता है और सिर्फ़ 2% normal payments को ग़लती से flag करता है। क्या यह payment शायद fraud है? ज़्यादातर लोग कहते हैं “99% हाँ”। असली जवाब लगभग 5% है – और Bayes theorem बताता है क्यों। Probability की सोच महँगी गलतियाँ रोकती है।
Probability = लंबे समय की frequency
import numpy as np
rng = np.random.default_rng(42)
for n in [10, 100, 10_000, 1_000_000]:
    rolls = rng.integers(1, 7, n)
print(f"{n:>9,} dice rolls → P(six) ≈ {(rolls == 6).mean():.4f} (true = {1/6:.4f})")import numpy as np
import matplotlib.pyplot as plt
rng = np.random.default_rng(7)
flips = rng.integers(0, 2, 3000)
running = flips.cumsum() / np.arange(1, 3001)
plt.figure(figsize=(9, 3.4))
plt.plot(running, color="#4f46e5"); plt.axhline(0.5, color="#dc2626", ls="--")
plt.xscale("log"); plt.ylim(0, 1)
plt.title("Law of large numbers: share of heads settles at 0.5"); plt.xlabel("number of flips (log scale)")
plt.show()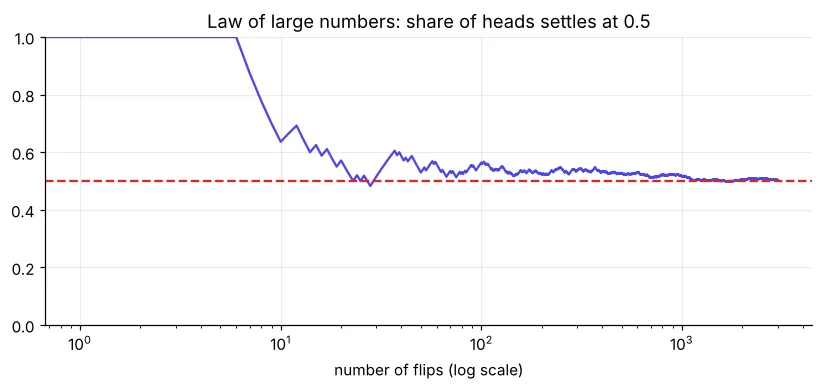
तीन नियम
| नियम | Formula | उदाहरण |
|---|---|---|
| NOT | P(not A) = 1 − P(A) | P(not churn) = 1 − 0.29 = 0.71 |
| OR | P(A or B) = P(A) + P(B) − P(A and B) | Senior या monthly contract |
| AND (स्वतंत्र) | P(A and B) = P(A) × P(B) | दो अलग customers दोनों churn |
| AND (सामान्य) | P(A and B) = P(A) × P(B | A) | Monthly और churn |
import pandas as pd
t = pd.read_csv("telecom_churn.csv")
A = t["senior_citizen"] == 1
B = t["contract"] == "Monthly"
pA, pB, pAB = A.mean(), B.mean(), (A & B).mean()
print(f"P(senior)={pA:.3f}  P(monthly)={pB:.3f}  P(both)={pAB:.3f}")
print(f"P(senior or monthly) by rule = {pA + pB - pAB:.3f} | counted directly = {(A | B).mean():.3f}")
print(f"P(not churn) = {1 - (t['churn'] == 'Yes').mean():.3f}")Conditional probability
P(A | B) = “B दिया होने पर A की probability” = P(A and B) ÷ P(B)। Data में यह बस filtered group के अंदर का rate है।
import pandas as pd
t = pd.read_csv("telecom_churn.csv")
churn = t["churn"] == "Yes"
print(f"P(churn)               = {churn.mean():.3f}")
print(f"P(churn | Monthly)     = {churn[t['contract'] == 'Monthly'].mean():.3f}")
print(f"P(churn | Two year)    = {churn[t['contract'] == 'Two year'].mean():.3f}")
print(f"P(Monthly | churn)     = {(t.loc[churn, 'contract'] == 'Monthly').mean():.3f}   ← not the same thing!")
print(pd.crosstab(t["contract"], t["churn"], margins=True))“ज़्यादातर churners monthly plans पर हैं” (P(monthly | churn) ≈ 0.83) और “ज़्यादातर monthly customers churn करते हैं” (P(churn | monthly) ≈ 0.44) अलग बातें हैं। इन्हें मिलाना reports और news की सबसे आम गलतियों में है।
import pandas as pd
t = pd.read_csv("telecom_churn.csv")
churn = (t["churn"] == "Yes")
both = churn[(t["contract"] == "Monthly") & (t["tech_support"] == "No")].mean()
print(f"P(churn | monthly AND no tech support) = {both:.3f}")
print(f"Lift over average = {both / churn.mean():.2f}x")स्वतंत्रता (Independence)
import pandas as pd
t = pd.read_csv("telecom_churn.csv")
churn = t["churn"] == "Yes"
for col in ["gender", "contract"]:
    rates = churn.groupby(t[col]).mean().round(3).to_dict()
    print(col, rates)
print("Gender: rates ≈ equal → churn looks independent of gender. Contract: very different → dependent.")Bayes theorem
P(A | B) = P(B | A) × P(A) ÷ P(B)। यह नए सबूत से पुराने विश्वास (prior) को update करता है।
p_fraud = 0.001          # 1 in 1,000 payments is fraud (prior)
sens = 0.99              # P(flag | fraud)
fpr = 0.02               # P(flag | normal)
p_flag = sens * p_fraud + fpr * (1 - p_fraud)
post = sens * p_fraud / p_flag
print(f"P(flag) = {p_flag:.4f}")
print(f"P(fraud | flag) = {post:.3f} → only {post * 100:.1f}% of flagged payments are fraud")import numpy as np
rng = np.random.default_rng(1)
n = 1_000_000
fraud = rng.random(n) < 0.001
flag = np.where(fraud, rng.random(n) < 0.99, rng.random(n) < 0.02)
print("Flagged payments:", flag.sum(), "| real fraud among them:", (flag & fraud).sum())
print(f"Simulated P(fraud | flag) = {(flag & fraud).sum() / flag.sum():.3f}")Flagged payments को अपने-आप block न करें – इससे ~20,000 ईमानदार customers परेशान होंगे। Flag पर OTP check चलाएँ। वही model, बहुत बेहतर फ़ैसला।
Expected value
# Should we give a ₹200 retention coupon to a customer with 40% churn risk?
p_churn = 0.40
monthly_bill, months_left = 700, 12
coupon = 200
p_churn_with_coupon = 0.28             # assumed from a past test
ev_no = (1 - p_churn) * monthly_bill * months_left
ev_yes = (1 - p_churn_with_coupon) * monthly_bill * months_left - coupon
print(f"Expected revenue without coupon: ₹{ev_no:,.0f}")
print(f"Expected revenue with coupon: ₹{ev_yes:,.0f} → {'give' if ev_yes > ev_no else 'skip'} the coupon")🏅 आज के Job Skills
Practice tasks
🏋️ Practice – ख़ुद करें
Solution देखें
import pandas as pd
l = pd.read_csv("loan_applications.csv")
print(round(l.loc[l["credit_score"] > 750, "approved"].mean(), 3), round(l.loc[l["credit_score"] < 650, "approved"].mean(), 3))Solution देखें
import numpy as np
rng = np.random.default_rng(0)
days = rng.integers(0, 365, (100_000, 30))
share = np.array([len(set(r)) < 30 for r in days])
print(round(share.mean(), 3))
Solution देखें
p, sens, spec = 0.02, 0.95, 0.97
print(round(sens * p / (sens * p + (1 - spec) * (1 - p)), 3))
Quick quiz
🧠 Quick Quiz – ख़ुद को जाँचें
Interview corner
💼 Interview Corner
Bayes theorem उदाहरण के साथ समझाइए।
यह सबूत से hypothesis की probability update करता है: posterior = likelihood × prior ÷ evidence। उदाहरण: 0.1% base rate पर 99% recall और 2% false-positive वाला fraud flag – flagged payment के fraud होने का सिर्फ़ ~5% chance।
P(A|B) और P(B|A) में क्या फ़र्क है?
P(A|B) group B के अंदर A का rate है; P(B|A) group A के अंदर B का rate। ये Bayes theorem से जुड़े हैं और आमतौर पर बहुत अलग होते हैं।
सारांश
- Probability = लंबे समय की frequency; simulate करके जाँचें।
- NOT, OR (overlap घटाएँ), AND (गुणा, dependent हो तो conditional)।
- P(A|B) = group B में A का rate; P(B|A) से कभी न मिलाएँ।
- Bayes: base rates मायने रखते हैं। Expected value फ़ैसलों में मदद करता है।
Day 28: probability distributions – normal, binomial और Poisson, और ये क्या predict करते हैं।
