दिन 30: Hypothesis Testing: t-test और Chi-square
✅ आज आप सीखेंगे
- H₀, H₁, α और 5-step process
- p-value – क्या है और क्या नहीं
- t-tests: one-sample, two-sample, paired
- Categories के लिए chi-square, 3+ groups के लिए ANOVA
- Type I/II errors, effect size, कब कौन सा test
🏢 असली दुनिया में
Tech support वाले customers 25% churn करते हैं, बिना वाले 37%। Manager कहता है “साफ़ है tech support काम करता है – सबको दो!” एक शंकालु कहता है “यह बस random शोर है”। Hypothesis test बहस को राय से नहीं, सबूत से सुलझाता है।
5-step process
- 1H₀ (कोई असर नहीं) और H₁ (असर है) लिखें
- 2α चुनें (आमतौर पर 0.05)
- 3Test चुनकर statistic निकालें
- 4p-value लें
- 5फ़ैसला करें और business भाषा में समझाएँ
H₀ = “निर्दोष” (कोई अंतर नहीं)। इसे reject करने के लिए मज़बूत सबूत (छोटा p-value) चाहिए। H₀ reject न होना निर्दोषता साबित नहीं करता – बस सबूत काफ़ी नहीं।
Simulation से p-value
p-value = अगर H₀ सच होता, तो सिर्फ़ संयोग से इतना या इससे बड़ा अंतर कितनी बार दिखता?
import numpy as np
import pandas as pd
t = pd.read_csv("telecom_churn.csv")
t = t[t["tech_support"] != "No internet"]
churn = (t["churn"] == "Yes").to_numpy()
has_ts = (t["tech_support"] == "Yes").to_numpy()
observed = churn[~has_ts].mean() - churn[has_ts].mean()
rng = np.random.default_rng(0)
diffs = []
for _ in range(5000):                       # shuffle labels = world where H0 is true
    lab = rng.permutation(has_ts)
    diffs.append(churn[~lab].mean() - churn[lab].mean())
diffs = np.array(diffs)
print(f"Observed difference: {observed:.3f}")
print(f"Largest shuffled difference: {diffs.max():.3f}")
print(f"p-value ≈ {(np.abs(diffs) >= abs(observed)).mean():.4f}")import numpy as np
import pandas as pd
import matplotlib.pyplot as plt
t = pd.read_csv("telecom_churn.csv"); t = t[t["tech_support"] != "No internet"]
churn = (t["churn"] == "Yes").to_numpy(); ts = (t["tech_support"] == "Yes").to_numpy()
obs = churn[~ts].mean() - churn[ts].mean()
rng = np.random.default_rng(0)
d = [churn[~(l := rng.permutation(ts))].mean() - churn[l].mean() for _ in range(5000)]
plt.figure(figsize=(9, 3.5))
plt.hist(d, bins=40, color="#cbd5e1", label="differences if H₀ were true")
plt.axvline(obs, color="#dc2626", lw=2.5, label=f"observed = {obs:.3f}")
plt.title("The real difference is far outside what chance produces → reject H₀"); plt.legend()
plt.show()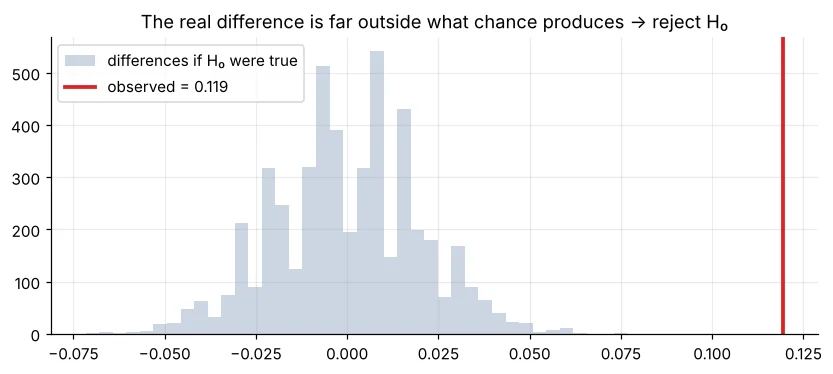
| p-value | सीधा मतलब |
|---|---|
| < 0.01 | H₀ के ख़िलाफ़ बहुत मज़बूत सबूत |
| 0.01–0.05 | H₀ के ख़िलाफ़ सबूत (5% पर significant) |
| 0.05–0.10 | कमज़ोर सबूत – और data लें |
| > 0.10 | अंतर का कोई सबूत नहीं |
यह H₀ के सच होने की probability नहीं है, और असर कितना बड़ा या ज़रूरी है, यह नहीं बताता। बहुत बड़े data में छोटे बेकार अंतर भी “significant” हो जाते हैं। हमेशा effect size भी बताएँ।
t-tests
import pandas as pd
from scipy import stats
s = pd.read_csv("sales_data.csv")
r = s["rating"].dropna()
# One-sample: is the average rating different from the target 4.0?
res = stats.ttest_1samp(r, 4.0)
print(f"mean {r.mean():.3f} | t={res.statistic:.2f} p={res.pvalue:.4f}")import pandas as pd
from scipy import stats
t = pd.read_csv("telecom_churn.csv")
yes = t.loc[t["churn"] == "Yes", "monthly_charges"]
no = t.loc[t["churn"] == "No", "monthly_charges"]
res = stats.ttest_ind(yes, no, equal_var=False) # Welch’s t-test (safer)
pooled = ((yes.var() + no.var()) / 2) ** 0.5
print(f"churners ₹{yes.mean():.0f} vs stayers ₹{no.mean():.0f}")
print(f"t={res.statistic:.2f}, p={res.pvalue:.2e}, Cohen's d={(yes.mean() - no.mean()) / pooled:.2f}")import numpy as np
from scipy import stats
rng = np.random.default_rng(4)
before = rng.normal(62, 9, 40).round() # mock-test marks before a crash course
after = (before + rng.normal(3, 4, 40)).round() # same 40 students after
res = stats.ttest_rel(after, before)
print(f"avg gain {np.mean(after - before):.2f} marks | t={res.statistic:.2f} p={res.pvalue:.4f}")Chi-square: दो categorical variables
import pandas as pd
from scipy import stats
t = pd.read_csv("telecom_churn.csv")
for col in ["contract", "gender"]:
    table = pd.crosstab(t[col], t["churn"])
    chi2, p, dof, expected = stats.chi2_contingency(table)
    print(f"{col:9s} chi2={chi2:7.1f} dof={dof} p={p:.3g}")
print(pd.crosstab(t["gender"], t["churn"]))ANOVA: तीन या ज़्यादा groups
import pandas as pd
from scipy import stats
h = pd.read_csv("house_prices.csv")
h["ppsf"] = h["price_lakh"] * 1e5 / h["area_sqft"]
groups = [g["ppsf"] for _, g in h.groupby("furnishing")]
f, p = stats.f_oneway(*groups)
print(h.groupby("furnishing")["ppsf"].mean().round(0).to_dict())
print(f"ANOVA F={f:.2f}, p={p:.4f}")Errors और power
| H₀ सच | H₀ ग़लत | |
|---|---|---|
| H₀ reject | Type I error (झूठा alarm), rate = α | सही (power) |
| H₀ रखें | सही | Type II error (असर चूका), rate = β |
import numpy as np
from scipy import stats
rng = np.random.default_rng(0)
false_alarms = sum(stats.ttest_ind(rng.normal(0, 1, 50), rng.normal(0, 1, 50)).pvalue < 0.05 for _ in range(2000))
print(f"No real difference, yet 'significant' in {false_alarms / 2000:.1%} of tests (≈ α)")
for n in [20, 50, 200]:
    power = np.mean([stats.ttest_ind(rng.normal(0, 1, n), rng.normal(0.3, 1, n)).pvalue < 0.05 for _ in range(2000)])
print(f"real small effect (d=0.3), n={n:3d} per group → detected {power:.0%} of the time")कौन सा test लूँ?
| सवाल | Data | Test (scipy.stats) |
|---|---|---|
| Mean vs target | 1 numeric | ttest_1samp |
| दो groups के means | numeric + 2 groups | ttest_ind (equal_var=False) |
| पहले vs बाद, वही लोग | 2 paired numeric | ttest_rel |
| 3+ groups के means | numeric + 3+ groups | f_oneway |
| दो categories जुड़ी हैं? | 2 categorical | chi2_contingency |
| दो proportions | counts | proportions_ztest (statsmodels) – Day 31 |
| Non-normal / ranks | numeric | mannwhitneyu, kruskal |
🏅 आज के Job Skills
Practice tasks
🏋️ Practice – ख़ुद करें
Solution देखें
import pandas as pd
from scipy import stats
st = pd.read_csv("students_performance.csv")
a = st.loc[st["internet"] == "Yes", "average"]; b = st.loc[st["internet"] == "No", "average"]
print(f"difference {a.mean() - b.mean():.2f} marks, p = {stats.ttest_ind(a, b, equal_var=False).pvalue:.4f}")Solution देखें
import pandas as pd
from scipy import stats
s = pd.read_csv("sales_data.csv")
chi2, p, dof, _ = stats.chi2_contingency(pd.crosstab(s["region"], s["payment_mode"]))
print(round(chi2, 2), dof, round(p, 4))Solution देखें
import pandas as pd
from scipy import stats
h = pd.read_csv("house_prices.csv"); h["ppsf"] = h["price_lakh"] * 1e5 / h["area_sqft"]
r = stats.f_oneway(*[g["ppsf"] for _, g in h.groupby("city")])
print(f"F={r.statistic:.1f}, p={r.pvalue:.1e}")Quick quiz
🧠 Quick Quiz – ख़ुद को जाँचें
Interview corner
💼 Interview Corner
Non-technical व्यक्ति को p-value समझाइए।
“अगर सच में कोई अंतर न होता, तो इतना बड़ा अंतर संयोग से 100 में सिर्फ़ p×100 बार होता। यह बहुत दुर्लभ है, इसलिए हम मानते हैं कि अंतर असली है।” फिर बताएँ अंतर कितना बड़ा है।
Statistically significant vs practically significant?
Statistical significance कहती है असर शोर नहीं लगता। Practical significance पूछती है क्या यह इतना बड़ा है कि मायने रखे (₹ impact, effect size)। लाखों rows में 0.1% lift significant पर बेकार हो सकता है।
सारांश
- H₀ = कोई असर नहीं; छोटा p-value = उसके ख़िलाफ़ सबूत।
- p-value न P(H₀ सच) है, न effect size।
- Means के लिए t-tests, categories के लिए chi-square, 3+ groups के लिए ANOVA।
- Type I/II errors, power और multiple testing का ध्यान रखें।
Day 31: correlation और A/B testing – design से फ़ैसले तक पूरा website experiment चलाएँ।
