दिन 39: Multiple Regression, Ridge और Lasso
✅ आज आप सीखेंगे
- एक साथ कई features
- City और furnishing को one-hot encode करना
- Coefficients “बाकी स्थिर रखकर” पढ़ना
- Multicollinearity और log-transformed targets
- Ridge और Lasso: features सिकोड़ना और चुनना
🏢 असली दुनिया में
सिर्फ़ area वाला model हर flat पर ₹7 lakh ग़लत था। Buyers city, metro दूरी, उम्र, furnishing और parking की भी परवाह करते हैं। जो model सबका इस्तेमाल करे – और बताए कि हर एक rupees में कितना कीमती है – वह pricing tool बनता है जिस पर sales teams भरोसा करती हैं।
Step 1: categories को numbers में बदलें
import pandas as pd
h = pd.read_csv("house_prices.csv")
X = pd.get_dummies(h.drop(columns="price_lakh"), columns=["city", "furnishing", "parking"], drop_first=True, dtype=int)
print(X.columns.tolist())
print(X.head(3))5 शहरों में से 4 columns रखते हैं; हटाया गया (Bengaluru) reference बनता है। तब हर city coefficient का मतलब है “Bengaluru से अंतर”। सभी 5 रखने से perfect collinearity होती है (dummy-variable trap)।
Step 2: fit और evaluate
import pandas as pd
from sklearn.model_selection import train_test_split
from sklearn.linear_model import LinearRegression
from sklearn.metrics import mean_absolute_error, r2_score
h = pd.read_csv("house_prices.csv")
X = pd.get_dummies(h.drop(columns="price_lakh"), columns=["city", "furnishing", "parking"], drop_first=True, dtype=int)
y = h["price_lakh"]
X_tr, X_te, y_tr, y_te = train_test_split(X, y, test_size=0.25, random_state=42)
area_only = LinearRegression().fit(X_tr[["area_sqft"]], y_tr)
full = LinearRegression().fit(X_tr, y_tr)
for name, m, cols in [("area only", area_only, ["area_sqft"]), ("all features", full, X.columns)]:
    p = m.predict(X_te[cols])
print(f"{name:13s} MAE = ₹{mean_absolute_error(y_te, p):.2f} lakh R² = {r2_score(y_te, p):.3f}")Step 3: हर feature कितना कीमती है?
import pandas as pd
from sklearn.linear_model import LinearRegression
h = pd.read_csv("house_prices.csv")
X = pd.get_dummies(h.drop(columns="price_lakh"), columns=["city", "furnishing", "parking"], drop_first=True, dtype=int)
m = LinearRegression().fit(X, h["price_lakh"])
coef = pd.Series(m.coef_, index=X.columns).round(3)
print(coef.sort_values().to_string())हर number उस feature की +1 unit पर price (₹ lakh) का बदलाव है, बाकी सबको स्थिर रखकर। उदाहरण: metro_km ≈ −1.7 मतलब उसी size, शहर और उम्र के लिए metro से हर extra km कीमत लगभग ₹1.7 lakh घटाता है।
Bedrooms और bathrooms, area से बहुत correlated हैं। Area स्थिर रखने पर extra bedroom का मतलब छोटे कमरे – इसलिए coefficient छोटा या negative हो सकता है। यही multicollinearity है: predictions ठीक, अलग coefficients अस्थिर।
import pandas as pd
from statsmodels.stats.outliers_influence import variance_inflation_factor
h = pd.read_csv("house_prices.csv")
num = h[["area_sqft", "bedrooms", "bathrooms", "age_years", "metro_km"]].assign(const=1)
vif = pd.Series([variance_inflation_factor(num.values, i) for i in range(num.shape[1] - 1)], index=num.columns[:-1]).round(2)
print(vif.to_string())
print("VIF > 5 → strongly explained by the other features")बेहतर target: log(price)
कीमतें percentages में बढ़ती हैं (metro station हर flat में % जोड़ता है), और right-skewed हैं। log(price) model करना अक्सर बेहतर fit देता है और coefficients “% बदलाव” बन जाते हैं।
import numpy as np
import pandas as pd
from sklearn.model_selection import train_test_split
from sklearn.linear_model import LinearRegression
from sklearn.metrics import mean_absolute_error
h = pd.read_csv("house_prices.csv")
X = pd.get_dummies(h.drop(columns="price_lakh"), columns=["city", "furnishing", "parking"], drop_first=True, dtype=int)
X["log_area"] = np.log(X["area_sqft"])
y = h["price_lakh"]
X_tr, X_te, y_tr, y_te = train_test_split(X, y, test_size=0.25, random_state=42)
plain = LinearRegression().fit(X_tr.drop(columns="log_area"), y_tr)
logm = LinearRegression().fit(X_tr.drop(columns="area_sqft"), np.log(y_tr))
p1 = plain.predict(X_te.drop(columns="log_area"))
p2 = np.exp(logm.predict(X_te.drop(columns="area_sqft")))
print(f"price model     MAE = ₹{mean_absolute_error(y_te, p1):.2f} lakh")
print(f"log-price model MAE = ₹{mean_absolute_error(y_te, p2):.2f} lakh")
c = pd.Series(logm.coef_, index=X_tr.drop(columns="area_sqft").columns)
print(f"each km from metro → {(np.exp(c['metro_km']) - 1) * 100:.1f}% price | furnished → {(np.exp(c['furnishing_Unfurnished']) - 1) * -100:.1f}% more than unfurnished")Regularisation: Ridge और Lasso
import numpy as np
import pandas as pd
from sklearn.model_selection import train_test_split
from sklearn.linear_model import LinearRegression, Ridge, Lasso
from sklearn.preprocessing import StandardScaler
from sklearn.pipeline import make_pipeline
h = pd.read_csv("house_prices.csv")
X = pd.get_dummies(h.drop(columns="price_lakh"), columns=["city", "furnishing", "parking"], drop_first=True, dtype=int)
rng = np.random.default_rng(0)
for i in range(30):                                   # add 30 useless noise columns
    X[f"noise_{i}"] = rng.normal(size=len(X))
X_tr, X_te, y_tr, y_te = train_test_split(X, h["price_lakh"], test_size=0.5, random_state=1)
for name, est in [("Linear", LinearRegression()), ("Ridge α=10", Ridge(alpha=10)), ("Lasso α=0.3", Lasso(alpha=0.3, max_iter=20000))]:
    m = make_pipeline(StandardScaler(), est).fit(X_tr, y_tr)
    coefs = m[-1].coef_
print(f"{name:12s} test R²={m.score(X_te, y_te):.3f} | non-zero coefs={np.sum(np.abs(coefs) > 1e-6):2d} of {len(coefs)}")import numpy as np
import pandas as pd
import matplotlib.pyplot as plt
from sklearn.linear_model import Lasso
from sklearn.preprocessing import StandardScaler
h = pd.read_csv("house_prices.csv")
X = pd.get_dummies(h.drop(columns="price_lakh"), columns=["city", "furnishing", "parking"], drop_first=True, dtype=int)
Xs = StandardScaler().fit_transform(X)
alphas = np.logspace(-2, 1.3, 40)
paths = np.array([Lasso(alpha=a, max_iter=20000).fit(Xs, h["price_lakh"]).coef_ for a in alphas])
plt.figure(figsize=(9, 4.2))
for j, col in enumerate(X.columns):
plt.plot(alphas, paths[:, j], label=col if j < 9 else None)
plt.xscale("log"); plt.axhline(0, color="black", lw=0.6)
plt.xlabel("alpha (penalty strength)"); plt.ylabel("coefficient (scaled)")
plt.title("Lasso path: weak features drop to zero first; area survives longest")
plt.legend(fontsize=7, ncol=2); plt.show()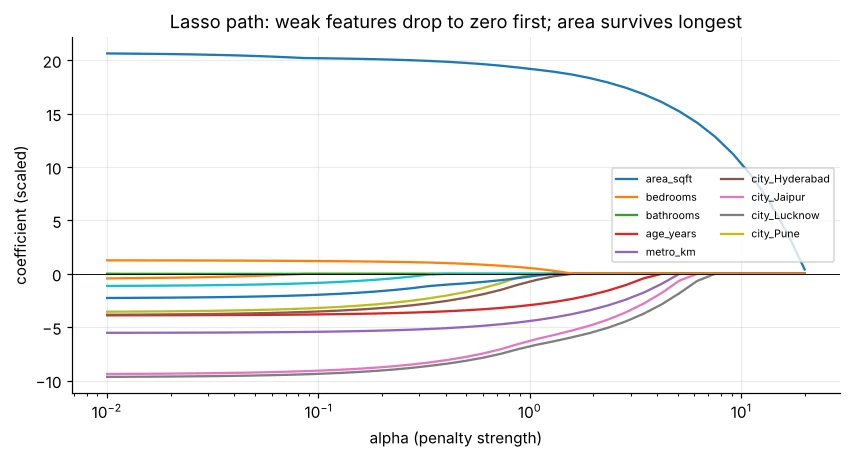
import pandas as pd
from sklearn.linear_model import RidgeCV, LassoCV
from sklearn.preprocessing import StandardScaler
from sklearn.pipeline import make_pipeline
h = pd.read_csv("house_prices.csv")
X = pd.get_dummies(h.drop(columns="price_lakh"), columns=["city", "furnishing", "parking"], drop_first=True, dtype=int)
ridge = make_pipeline(StandardScaler(), RidgeCV(alphas=[0.01, 0.1, 1, 10, 100])).fit(X, h["price_lakh"])
lasso = make_pipeline(StandardScaler(), LassoCV(cv=5, random_state=0, max_iter=20000)).fit(X, h["price_lakh"])
print("best Ridge alpha:", ridge[-1].alpha_, "| best Lasso alpha:", round(lasso[-1].alpha_, 4))🏅 आज के Job Skills
Practice tasks
🏋️ Practice – ख़ुद करें
average predict करें। कौन से features सबसे ज़रूरी?Solution देखें
import pandas as pd
from sklearn.linear_model import LinearRegression
st = pd.read_csv("students_performance.csv")
X = pd.get_dummies(st[["study_hours", "attendance", "tuition", "internet", "parent_education"]], drop_first=True, dtype=int)
m = LinearRegression().fit(X, st["average"])
print(pd.Series(m.coef_, index=X.columns).round(2).sort_values()); print("R²", round(m.score(X, st["average"]), 3))Solution देखें
import pandas as pd
from sklearn.linear_model import LassoCV
from sklearn.preprocessing import StandardScaler
st = pd.read_csv("students_performance.csv")
X = pd.get_dummies(st[["study_hours", "attendance", "tuition", "internet", "parent_education", "gender", "school_type"]], drop_first=True, dtype=int)
m = LassoCV(cv=5, random_state=0).fit(StandardScaler().fit_transform(X), st["average"])
print(pd.Series(m.coef_, index=X.columns).round(2))Quick quiz
🧠 Quick Quiz – ख़ुद को जाँचें
Interview corner
💼 Interview Corner
Ridge और Lasso में फ़र्क?
दोनों बड़े coefficients पर penalty लगाकर overfitting घटाते हैं। Ridge (L2) सभी coefficients सिकोड़ता है पर शून्य नहीं करता – correlated features में अच्छा। Lasso (L1) कुछ को ठीक शून्य कर feature selection करता है। Elastic Net दोनों का मिश्रण है।
Multicollinearity क्या है और क्यों मायने रखती है?
जब features आपस में बहुत correlated हों। Predictions सही रह सकती हैं, पर coefficients अस्थिर और समझने में मुश्किल हो जाते हैं। Correlation/VIF से पकड़ें; features हटाकर या जोड़कर या Ridge से ठीक करें।
सारांश
- Categories को one-hot (drop_first) करें और सभी features साथ fit करें।
- Coefficients = बाकी स्थिर रखकर असर; multicollinearity (VIF) पर ध्यान।
- log(price) अक्सर बेहतर fit और % असर देता है।
- Ridge सिकोड़ता, Lasso चुनता है; CV से α tune करें और पहले scale करें।
Day 40: logistic regression – numbers से हाँ/नहीं और probabilities predict करने तक।
