दिन 56: Project 1: Business Problem और Data
✅ आज आप सीखेंगे
- Churn telecom company को करोड़ों का नुकसान क्यों करता है, समझें
- Business लक्ष्य को ML समस्या में बदलें
- Data का audit करें और छिपे जाल पकड़ें
- Baseline मापें: churn rate और जोखिम वाला revenue
- Project charter और सफलता के metrics लिखें
🏢 असली दुनिया में
TeleOne, एक मध्यम आकार की Indian telecom और broadband company, साल में लगभग हर 10 में से 3 customers खो रही है। नया customer लाना एक को रोकने से लगभग पाँच गुना महँगा है। Head of Retention आपसे कहते हैं: “हर महीने मेरी team को उन customers की list दो जो जाने वाले हैं और बताओ क्यों – ताकि हम सही लोगों को सही offer के साथ call करें।” अगले पाँच दिनों में आप यही पूरा बनाएँगे, शुरू से आख़िर तक।
5-दिन का project plan
- 1Day 56 – business समस्या, data audit, baseline
- 2Day 57 – EDA, statistical tests, insights
- 3Day 58 – features, pipelines, model तुलना
- 4Day 59 – evaluation, threshold, ₹ impact, explanations
- 5Day 60 – deployment, risk list, report और presentation
Step 1: business समझें
Step 2: इसे ML समस्या बनाएँ
| सवाल | इस project का जवाब |
|---|---|
| Target (y) | churn = Yes / No → binary classification |
| Unit | एक row = एक customer |
| Prediction का समय | हर महीने की शुरुआत, उस दिन तक का data |
| Output | Churn की probability + हर customer के मुख्य कारण |
| कौन इस्तेमाल करेगा | Retention call-centre team (≈ 600 calls/महीना क्षमता) |
| मुख्य metric | ROC-AUC + सबसे risky 20% customers में recall |
| Business metric | Net ₹ बचत = बचाया revenue − offer cost |
हर column के लिए पूछें: “क्या यह customer के छोड़ने का फ़ैसला करने से पहले पता है?” “cancellation_reason” या “final_bill_date” जैसे columns leakage होंगे। हमारे data में सभी columns churn से पहले customer के बारे में हैं – पर हमेशा पूछें।
Step 3: data का audit
import pandas as pd
raw = pd.read_csv("telecom_churn.csv")
print(raw.shape)
print(raw.dtypes.astype(str).to_dict())
print("Missing values:\n", raw.isna().sum()[raw.isna().sum() > 0])
print("internet_service values:", raw["internet_service"].value_counts(dropna=False).to_dict())625 customers की internet service missing दिखती है – पर वह missing नहीं है! उनकी value text “None” है (कोई internet plan नहीं), और pandas default में “None” को NaN बना देता है। इन्हें बिना सोचे drop या fill करने से 21% data बिगड़ जाता।
import numpy as np
import pandas as pd

def load_churn(path="telecom_churn.csv"):
    # "None" means no internet plan – stop pandas from turning it into NaN
    df = pd.read_csv(path, keep_default_na=False, na_values=[""])
    df["total_charges"] = df["total_charges"].fillna(df["monthly_charges"] * df["tenure_months"])
    df["churned"] = (df["churn"] == "Yes").astype(int)
    return df

df = load_churn()
print(df["internet_service"].value_counts().to_dict())
print("Missing after load:", int(df.isna().sum().sum()))
print("Duplicates:", df["customer_id"].duplicated().sum())
check = (df["tech_support"] == "No internet") == (df["internet_service"] == "None")
print("tech_support consistent with internet_service:", bool(check.all()))import numpy as np
import pandas as pd
def load_churn(path="telecom_churn.csv"):
# "None" means no internet plan – stop pandas from turning it into NaN
df = pd.read_csv(path, keep_default_na=False, na_values=[""])
df["total_charges"] = df["total_charges"].fillna(df["monthly_charges"] * df["tenure_months"])
df["churned"] = (df["churn"] == "Yes").astype(int)
return df
df = load_churn()
rules = {"tenure 1–72 months": df["tenure_months"].between(1, 72).all(),
"monthly charges > 0": (df["monthly_charges"] > 0).all(),
"total ≈ monthly × tenure": (abs(df["total_charges"] - df["monthly_charges"] * df["tenure_months"]) / df["total_charges"] < 0.06).mean() > 0.95,
"complaints ≥ 0": (df["complaints"] >= 0).all(),
"churn only Yes/No": set(df["churn"]) == {"Yes", "No"}}
for rule, ok in rules.items():
print(("✅" if ok else "❌"), rule)Data dictionary
| Column | Type | मतलब |
|---|---|---|
| customer_id | id | Unique customer code |
| gender, senior_citizen | category / 0-1 | Demographics |
| tenure_months | number | TeleOne के साथ महीने (1–72) |
| contract | category | Monthly / One year / Two year |
| internet_service | category | Fiber / DSL / None |
| tech_support | category | Yes / No / No internet |
| payment_method | category | UPI AutoPay / Credit Card / Bank Transfer / Cash |
| monthly_charges, total_charges | ₹ | मौजूदा bill और कुल ख़र्च |
| complaints | count | पिछले 6 महीनों की शिकायतें |
| data_usage_gb | number | औसत monthly data |
| churn | target | Yes = छोड़ गया |
Step 4: baseline मापें
import numpy as np
import pandas as pd

def load_churn(path="telecom_churn.csv"):
    # "None" means no internet plan – stop pandas from turning it into NaN
    df = pd.read_csv(path, keep_default_na=False, na_values=[""])
    df["total_charges"] = df["total_charges"].fillna(df["monthly_charges"] * df["tenure_months"])
    df["churned"] = (df["churn"] == "Yes").astype(int)
    return df

df = load_churn()
churners = df[df["churned"] == 1]
rate = df["churned"].mean()
monthly_lost = churners["monthly_charges"].sum()
print(f"Customers: {len(df):,} | churned: {len(churners):,} | churn rate: {rate:.1%}")
print(f"Monthly revenue walking out: ₹{monthly_lost:,.0f}  → per year ≈ ₹{monthly_lost * 12 / 1e5:.1f} lakh")
print(f"Average bill – churners ₹{churners['monthly_charges'].mean():.0f} vs stayers ₹{df.loc[df['churned'] == 0, 'monthly_charges'].mean():.0f}")import numpy as np
import pandas as pd
def load_churn(path="telecom_churn.csv"):
# "None" means no internet plan – stop pandas from turning it into NaN
df = pd.read_csv(path, keep_default_na=False, na_values=[""])
df["total_charges"] = df["total_charges"].fillna(df["monthly_charges"] * df["tenure_months"])
df["churned"] = (df["churn"] == "Yes").astype(int)
return df
import matplotlib.pyplot as plt
df = load_churn()
fig, ax = plt.subplots(1, 2, figsize=(11, 3.8))
c = df["churn"].value_counts()
ax[0].pie(c, labels=[f"{k} ({v:,})" for k, v in c.items()], colors=["#94a3b8", "#dc2626"], autopct="%1.1f%%", startangle=90, wedgeprops=dict(width=0.45))
ax[0].set_title("29% of customers churned")
rev = df.groupby("churn")["monthly_charges"].sum() / 1e5
ax[1].bar(rev.index, rev.values, color=["#94a3b8", "#dc2626"]); ax[1].set_ylabel("₹ lakh per month")
ax[1].set_title("Monthly revenue: kept vs walked out")
for i, v in enumerate(rev.values): ax[1].text(i, v + 0.2, f"₹{v:.1f} L", ha="center")
plt.tight_layout(); plt.show()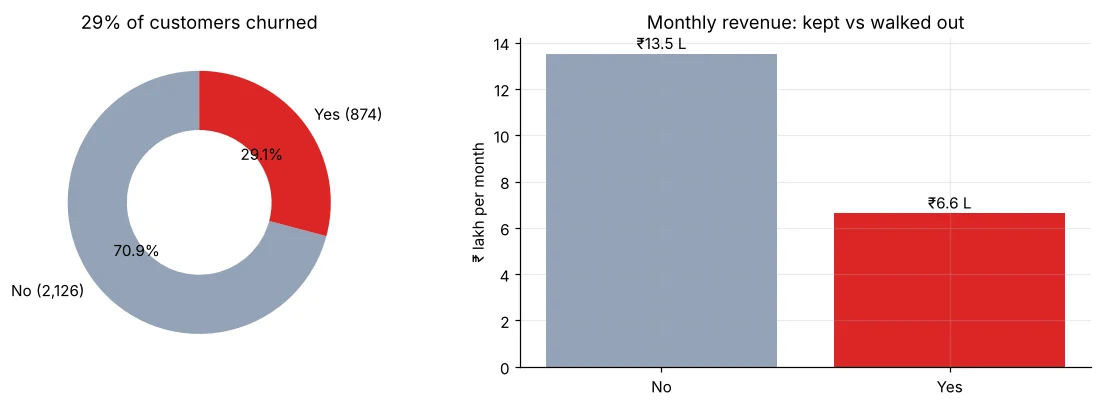
Step 5: business assumptions (retention team के साथ तय)
assumptions = {
    "retention offer": "₹100 off per month for 6 months",
    "offer cost per accepted customer (₹)": 600,
    "call cost per customer contacted (₹)": 40,
    "share of true churners saved by a call + offer": 0.30,
    "share of non-churners who still take the offer": 0.50,
    "value of a saved customer (₹)": "monthly bill × 12 (one more year)",
    "call capacity per month": 600,
}
for k, v in assumptions.items():
    print(f"{k:48s} {v}")
saved_value = 759 * 12            # average churner bill ≈ ₹759 (Step 4)
print(f"\nOne saved churner ≈ ₹{saved_value:,} of revenue; cost of trying = ₹40 call (+ ₹600 if they accept)")Day 59 में हम model output को rupees में बदलेंगे। Modelling से पहले call, offer और save-rate की cost तय करना evaluation को ईमानदार रखता है और business बाद में बिना काम दोहराए कोई number बदल सकता है।
Step 6: project charter
# TeleOne Churn Prediction – Project Charter
**Goal:** Reduce customer churn by targeting retention calls at customers most likely to leave.
**Users:** Retention team (600 calls / month).
**Deliverables:** (1) monthly risk list with top reasons, (2) Streamlit app for agents,
(3) model card and one-page report.
**Success metrics:** ROC-AUC ≥ 0.80 on unseen customers; ≥ 2× more churners reached
per call than random calling; positive net ₹ impact under agreed assumptions.
**Data:** 3,000 customers, 13 columns, snapshot at month start. No leakage columns.
**Risks:** small dataset; offer acceptance rate is an assumption → propose an A/B pilot.
**Timeline:** Day 56 problem & data · 57 EDA · 58 models · 59 evaluation · 60 deployment.
🏅 आज के Job Skills
Practice tasks
🏋️ Practice – ख़ुद करें
Solution देखें
import numpy as np
import pandas as pd

def load_churn(path="telecom_churn.csv"):
    # "None" means no internet plan – stop pandas from turning it into NaN
    df = pd.read_csv(path, keep_default_na=False, na_values=[""])
    df["total_charges"] = df["total_charges"].fillna(df["monthly_charges"] * df["tenure_months"])
    df["churned"] = (df["churn"] == "Yes").astype(int)
    return df

df = load_churn()
print(f"Random 600 calls reach ≈ {600 * df['churned'].mean():.0f} churners (the number our model must beat)")Solution देखें
import numpy as np
import pandas as pd

def load_churn(path="telecom_churn.csv"):
    # "None" means no internet plan – stop pandas from turning it into NaN
    df = pd.read_csv(path, keep_default_na=False, na_values=[""])
    df["total_charges"] = df["total_charges"].fillna(df["monthly_charges"] * df["tenure_months"])
    df["churned"] = (df["churn"] == "Yes").astype(int)
    return df

df = load_churn()
print(df[df["churned"] == 1].groupby("internet_service")["monthly_charges"].sum().sort_values(ascending=False))Quick quiz
🧠 Quick Quiz – ख़ुद को जाँचें
Interview corner
💼 Interview Corner
Churn prediction समस्या को कैसे frame करेंगे?
Churn और observation window, prediction का समय और horizon, unit (customer), मान्य features (churn से पहले पता), action (सीमित क्षमता वाले retention offers), और statistical (AUC, recall@capacity) व business (net बचत) दोनों तरह के success metrics तय करें।
पहले कौन से data-quality checks चलाते हैं?
Shape और types, missing values (और वे कैसे encode हैं!), key पर duplicates, सही ranges, columns के बीच तालमेल (total ≈ monthly × tenure), target values और class balance।
सारांश
- पहले business: churn revenue खाता है; action है targeted retention calls।
- ML framing: binary target, prediction का समय, कोई leakage नहीं, क्षमता के हिसाब से metrics।
- Audit में चुपचाप वाला “None” → NaN जाल मिला – load_churn() में ठीक।
- Baseline: 29% churn; 600 random calls से ~175 churners तक पहुँच।
Day 57: EDA – कौन churn करता है और क्यों, patterns को statistically test करें और पहली insights लिखें।
