📝 Unit 1 Board Questions + Practice
Unit 1 of the 2026-27 syllabus carries 25 marks. Part A has 24 new practice questions with answers (click "Show answer" only after you try). Part B has all 50 questions of Unit 1 from the previous CBSE board papers (2023, 2024, 2025, 2026) in their original form – tables, code and internal choices included – each with a worked answer.
1) Read the unit lessons first. 2) Solve Part A in your notebook, then check answers. 3) Attempt Part B paper-wise with a timer – about 1.5 minutes per mark. 4) Mark the questions you got wrong and revise that lesson again.
Part A – Practice questions with answers
A Series is created from a dictionary. Which becomes its index? (A) Dictionary keys (B) Dictionary values (C) Always 0,1,2... (D) Column names
Show answer
A: dictionary keys.
True or false: when Series use string labels, the slice s[1:3] includes positions 1, 2 and 3.
Show answer
False. Positions 1 and 2 only; the positional stop is excluded.
Which expression selects the row labelled R2? (A) df.loc["R2"] (B) df.loc("R2") (C) df.row["R2"] (D) df["R2"]
Show answer
A.
Fill in the blank: df.drop("Fee", axis=____) removes a column.
Show answer
1.
Choose the best chart for comparing student counts across four houses: line, bar or histogram.
Show answer
Bar chart.
Which plotting function saves the current figure to an image file?
Show answer
plt.savefig(), e.g. plt.savefig("chart.png") – call it before plt.show().
Predict the labelled output; ignore the dtype line.
import pandas as pd
s = pd.Series({'A':12, 'B':18, 'C':24, 'D':30})
print(s[1:3])
Show answer
B 18; C 24.
Predict the result, including missing values.
import pandas as pd
a = pd.Series([10,20,30], index=['x','y','z'])
b = pd.Series([2,4,6], index=['y','z','w'])
print(a + b)
Show answer
Label-aligned values: w NaN, x NaN, y 22.0, z 34.0 (order may be shown sorted).
Correct all errors in this code.
import Pandas as pd
s = pd.series([40,50,60], Index=['P','Q','R'])
Print(s)
Show answer
import pandas as pd
s = pd.Series([40, 50, 60], index=['P', 'Q', 'R'])
print(s)
Errors: Pandas → pandas, series → Series, Index → index, Print → print.
Create a Series with scalar value 100 and labels Jan, Feb and Mar.
Show answer
pd.Series(100, index=['Jan','Feb','Mar'])
Given s = pd.Series([11,22,33,44,55], index=list("abcde")), write statements to display its first two and last three elements.
Show answer
print(s.head(2))
print(s.tail(3))
Write one difference each between a Series and a DataFrame regarding dimensions and labelled axes.
Show answer
Series: one-dimensional with an index. DataFrame: two-dimensional with row index and column labels.
Create a Series from a NumPy array containing 72, 84 and 96 with labels English, IP and Maths. Display the Series after adding 4 to every value.
Show answer
import numpy as np
import pandas as pd
s=pd.Series(np.array([72,84,96]),index=['English','IP','Maths'])
print(s+4)
Using a dictionary of Series, create df with row labels S1, S2, S3: Name = Asha, Bharat, Charu; Marks = 81, 67, 92. Display it.
Show answer
df=pd.DataFrame({'Name':pd.Series(['Asha','Bharat','Charu'],index=['S1','S2','S3']),'Marks':pd.Series([81,67,92],index=['S1','S2','S3'])})
print(df)Create a DataFrame from a list of two dictionaries: {Book: Python, Price: 450} and {Book: SQL, Price: 380}. Use row labels B1 and B2.
Show answer
pd.DataFrame([{'Book':'Python','Price':450},{'Book':'SQL','Price':380}],index=['B1','B2'])For df from U1-14, independently write statements to: (i) select rows S1 and S3, (ii) display Name and Marks where Marks >= 80, (iii) rename Marks to Score.
Show answer
df.loc[['S1','S3']]
df.loc[df['Marks']>=80,['Name','Marks']]
df.rename(columns={'Marks':'Score'},inplace=True)The file attendance.csv has a header and columns Name, Days. Read it into att, print its last two records, and export it to checked.csv without the DataFrame index.
Show answer
att=pd.read_csv('attendance.csv')
print(att.tail(2))
att.to_csv('checked.csv',index=False)Using DataFrame df from U1-14, write a loop that prints each row label and the corresponding Name using iterrows().
Show answer
for label,row in df.iterrows(): print(label,row['Name'])
For df from U1-14, execute these in order: (i) add column Bonus with value 5, (ii) add S4 with Name Deepa, Marks 76, Bonus 5, (iii) remove row S2, (iv) remove Bonus.
Show answer
df['Bonus']=5
df.loc['S4']=['Deepa',76,5]
df.drop('S2',inplace=True)
df.drop(columns=['Bonus'],inplace=True)Complete the four blanks to display a labelled histogram.
import matplotlib.pyplot as plt
marks = [42,48,53,61,67,72,78,83,89,95]
plt.____(marks, bins=[40,60,80,100], label='Students')
plt.____('Marks')
plt.ylabel('Frequency')
plt.title('Marks distribution')
plt.____()
plt.____()
Show answer
hist; xlabel; legend; show.
Write a program to plot a line chart for months Apr, May, Jun, Jul and book issues 120, 150, 135, 180. Add axis labels, title Library Issues and legend Issues. Save as issues.png and display.
Show answer
import matplotlib.pyplot as plt
plt.plot(['Apr', 'May', 'Jun', 'Jul'], [120, 150, 135, 180], label='Issues')
plt.xlabel('Month')
plt.ylabel('Books issued')
plt.title('Library Issues')
plt.legend()
plt.savefig('issues.png')
plt.show()Write a program for a bar chart: houses Red, Blue, Green, Yellow; points 240, 280, 260, 300. Include a title, both axis labels and save as houses.png.
Show answer
import matplotlib.pyplot as plt
plt.bar(['Red', 'Blue', 'Green', 'Yellow'], [240, 280, 260, 300])
plt.title('House points')
plt.xlabel('House')
plt.ylabel('Points')
plt.savefig('houses.png')
plt.show()Create scholarship using a dictionary of Series: Name = Isha, Kabir, Meera, Nitin; Amount = 5000, 6500, 7200, 4800. Set row labels to a,b,c,d; display names with Amount >= 6000; remove row d.
Show answer
scholarship=pd.DataFrame({'Name':pd.Series(['Isha','Kabir','Meera','Nitin']),'Amount':pd.Series([5000,6500,7200,4800])})
scholarship.index=['a','b','c','d']
print(scholarship.loc[scholarship['Amount']>=6000,'Name'])
scholarship.drop('d',inplace=True)Assertion: a DataFrame may have a text column and a numeric column. Reason: every DataFrame column must contain only numeric values. Choose the correct assertion-reason option, explain it, and give a two-column example.
Show answer
C: assertion true, reason false. Example pd.DataFrame({'Name':['Asha'],'Marks':[81]}).
Part B – Previous year board questions (Unit 1)
CBSE Board Paper 2026 – 14 questions

Show answer
False – the positional index is always an integer (0, 1, 2 …); only the label index can be a string.

Show answer
(B) DF.loc[]
Show answer
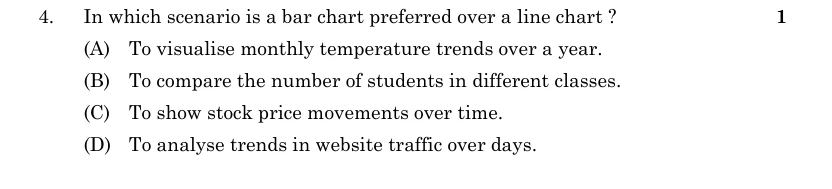
(B) To compare the number of students in different classes.
Show answer
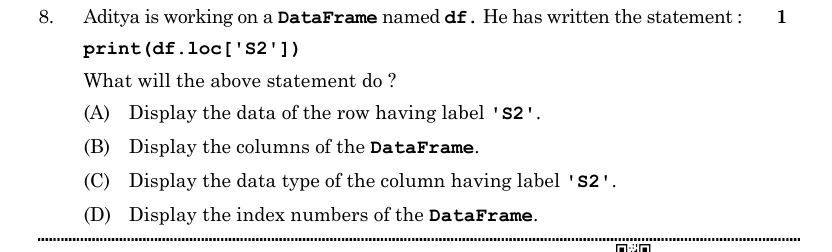
(A) Display the data of the row having label 'S2'.
Show answer
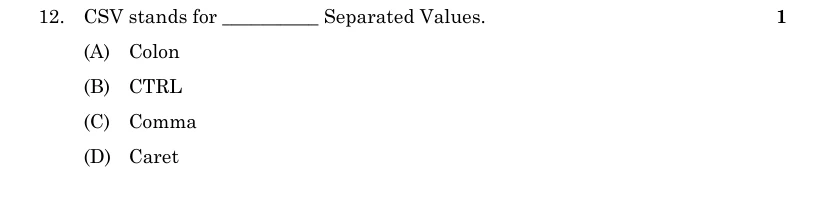
(C) Comma
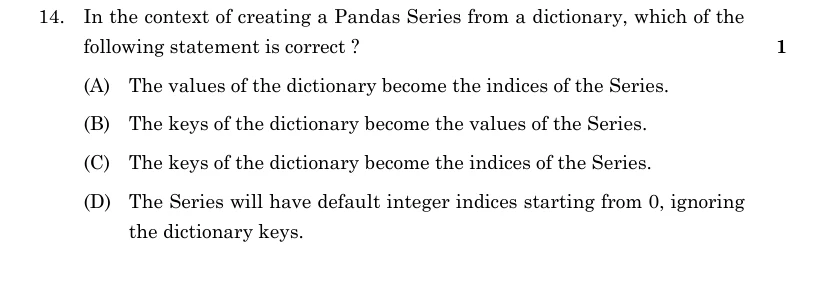
Show answer
(C) The keys of the dictionary become the indices of the Series.
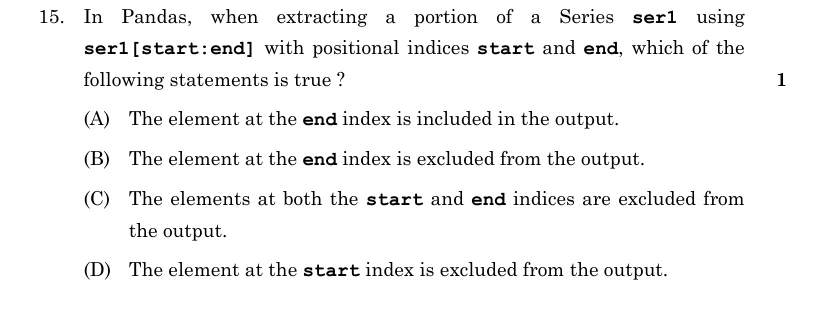
Show answer
(B) The element at the end index is excluded from the output.
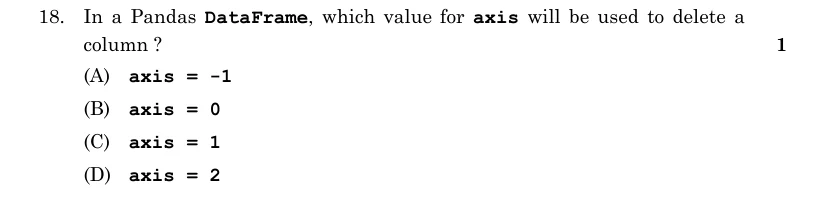
Show answer
(C) axis = 1

Show answer
(C) – Assertion is true, Reason is false: each DataFrame column can have its own data type (numbers, text, dates).
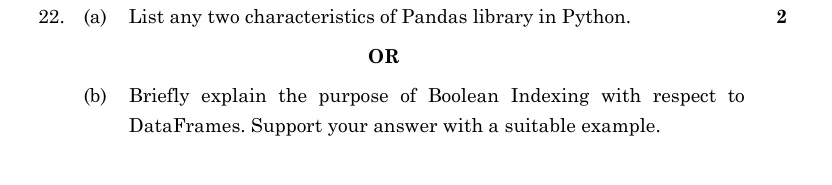
Show answer
(a) Any two: pandas provides fast, easy data structures (Series and DataFrame) with labelled indexes; it can read and write CSV, Excel and SQL data; it handles missing data; it supports grouping, sorting, filtering and statistics on large data.
OR (b) Boolean indexing selects only those rows for which a condition is True. A condition on a column gives a Series of True/False values, which is used inside [ ] or loc.
df = pd.DataFrame({'Name': ['Asha', 'Ravi', 'Neha'], 'Marks': [78, 45, 91]})
print(df[df['Marks'] > 60])      # rows of Asha and Neha only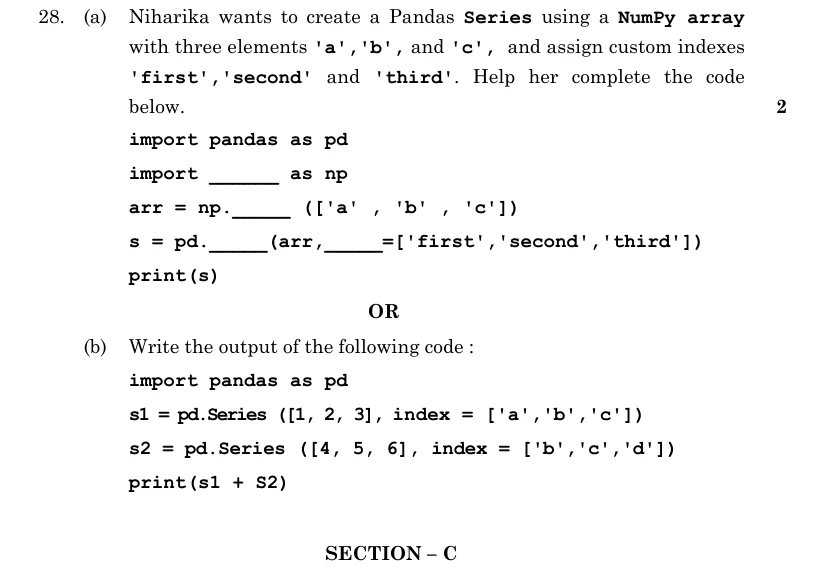
Show answer
(a) Blanks: numpy · array · Series · index
import pandas as pd
import numpy as np
arr = np.array(['a', 'b', 'c'])
s = pd.Series(arr, index=['first', 'second', 'third'])
print(s)
OR (b) As printed, the code uses S2 (capital S) which is not defined, so Python gives NameError. If S2 is corrected to s2, the output is:
a    NaN
b    6.0
c    8.0
d    NaN
dtype: float64
Show answer
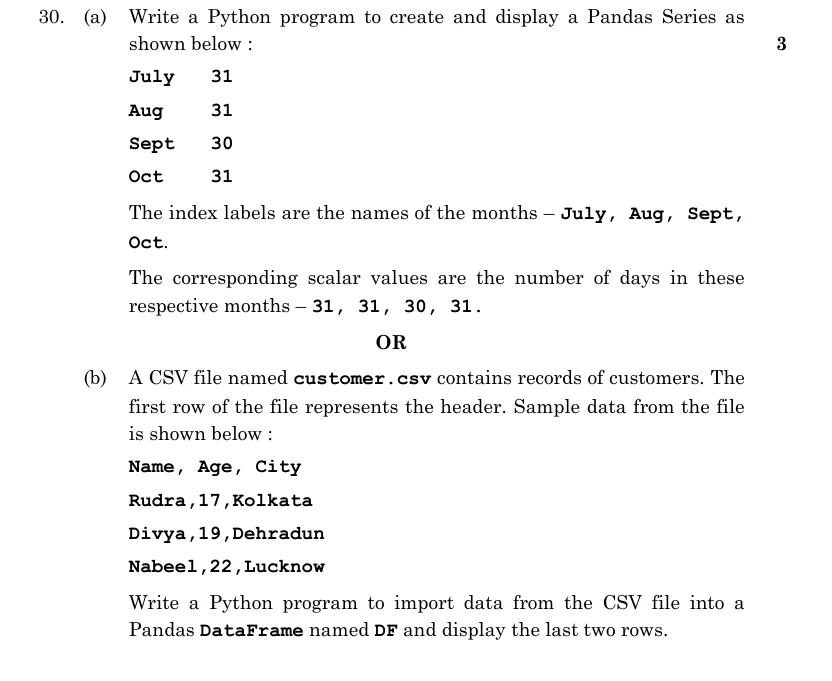
(a)
import pandas as pd
days = pd.Series([31, 31, 30, 31], index=['July', 'Aug', 'Sept', 'Oct'])
print(days)
OR (b)
import pandas as pd
DF = pd.read_csv('customer.csv')
print(DF.tail(2))
Show answer
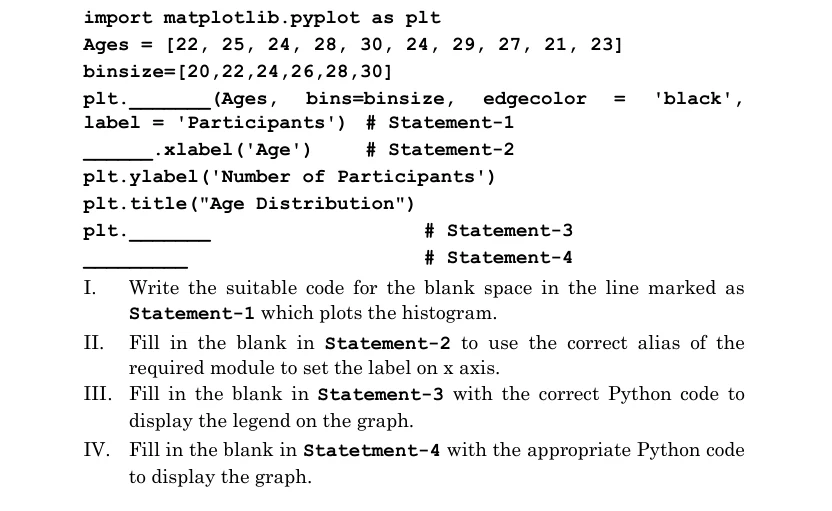
I. plt.hist(Ages, bins=binsize, edgecolor='black', label='Participants') II. plt.xlabel('Age') III. plt.legend() IV. plt.show()
Show answer
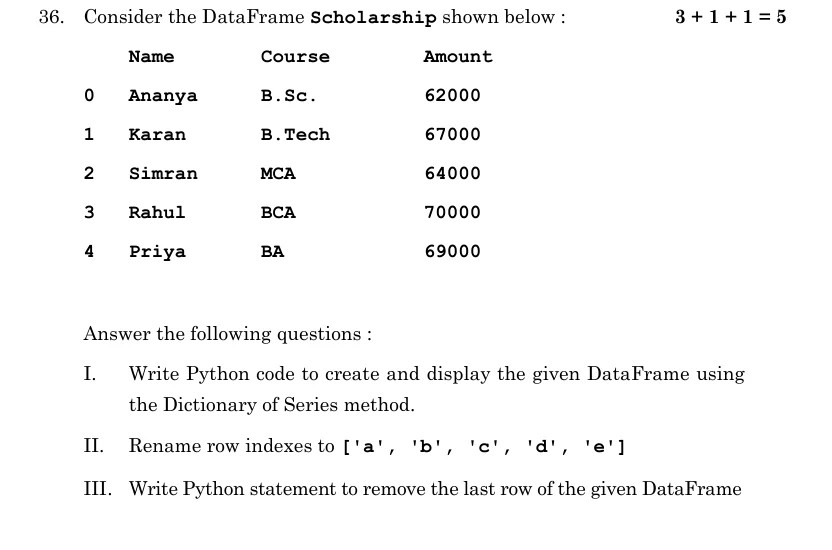
import pandas as pd
Name = pd.Series(['Ananya', 'Karan', 'Simran', 'Rahul', 'Priya'])
Course = pd.Series(['B.Sc.', 'B.Tech', 'MCA', 'BCA', 'BA'])
Amount = pd.Series([62000, 67000, 64000, 70000, 69000])
Scholarship = pd.DataFrame({'Name': Name, 'Course': Course, 'Amount': Amount})   # I
print(Scholarship)
Scholarship.index = ['a', 'b', 'c', 'd', 'e']                                     # II
Scholarship = Scholarship.drop('e')                                               # III (last row)
CBSE Board Paper 2025 – 14 questions

Show answer
False – pd.DataFrame() creates an empty DataFrame.
Show answer
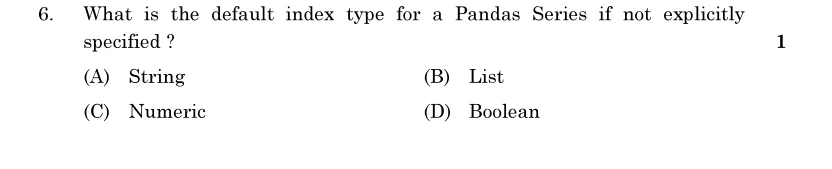
(C) Numeric – 0, 1, 2, … (RangeIndex).

Show answer
(D) savefig()

Show answer
(C) Series
Show answer
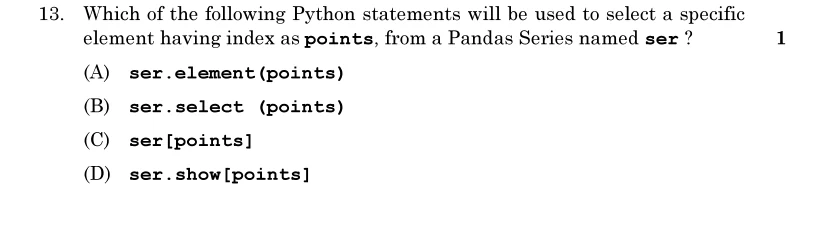
(C) ser[points] (written as ser['points'] when the label is a string).

Show answer
(B) numpy
Show answer
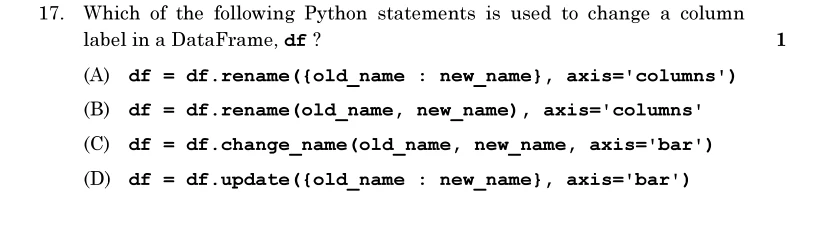
(A) df = df.rename({old_name : new_name}, axis='columns')

Show answer
(D) loc
Show answer
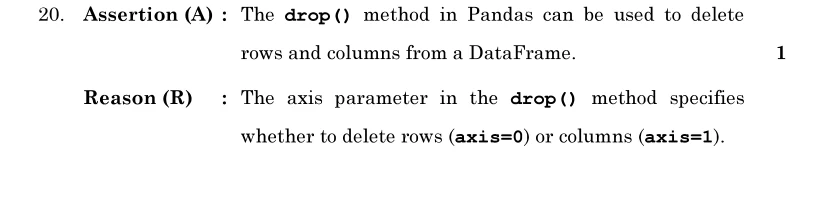
(A) – both are true and the axis parameter (0 = rows, 1 = columns) explains how drop() deletes rows or columns.
Show answer
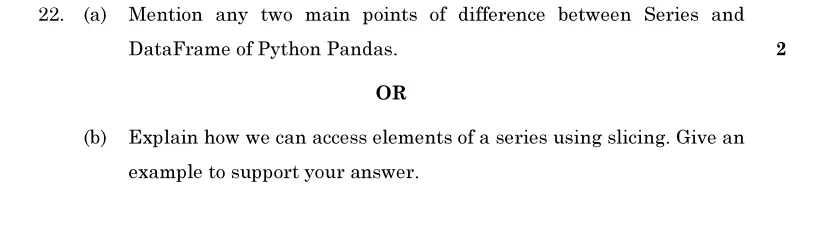
(a) Series is one-dimensional with only a row index; a DataFrame is two-dimensional with a row index and column labels. A Series holds one column of data (one data type), while each column of a DataFrame can have a different data type.
OR (b) Slicing uses [start:stop]; with positions the stop is excluded, with labels the stop is included.
s = pd.Series([10, 20, 30, 40], index=['a', 'b', 'c', 'd'])
print(s[1:3])        # b 20, c 30  (positions 1 and 2)
print(s['b':'d'])    # b 20, c 30, d 40  (end label included)
Show answer
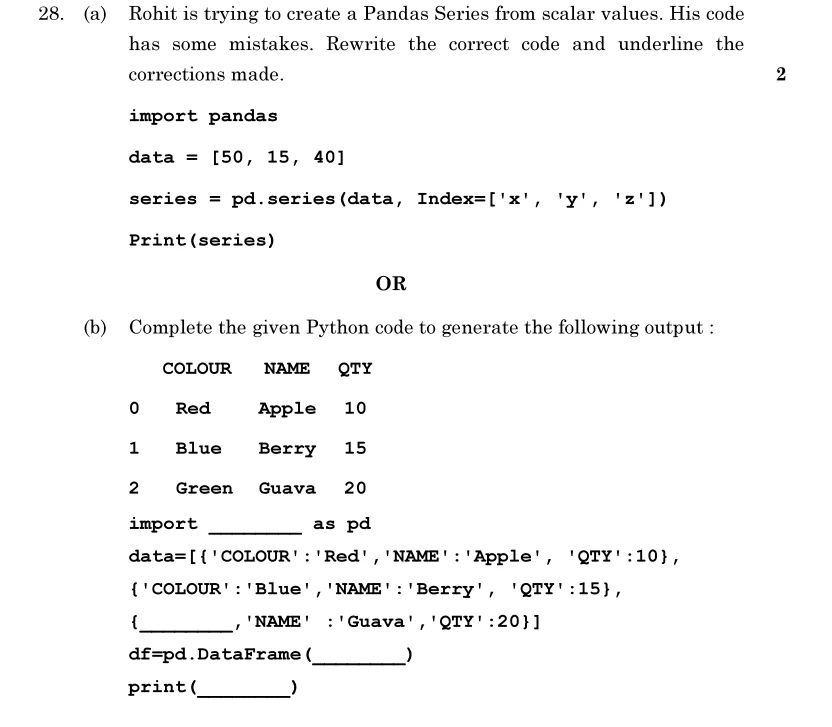
(a) Corrections: import pandas as pd, Series, index, print.
import pandas as pd
data = [50, 15, 40]
series = pd.Series(data, index=['x', 'y', 'z'])
print(series)
OR (b) Blanks: pandas · 'COLOUR':'Green' · data · df
import pandas as pd
data = [{'COLOUR': 'Red', 'NAME': 'Apple', 'QTY': 10},
        {'COLOUR': 'Blue', 'NAME': 'Berry', 'QTY': 15},
        {'COLOUR': 'Green', 'NAME': 'Guava', 'QTY': 20}]
df = pd.DataFrame(data)
print(df)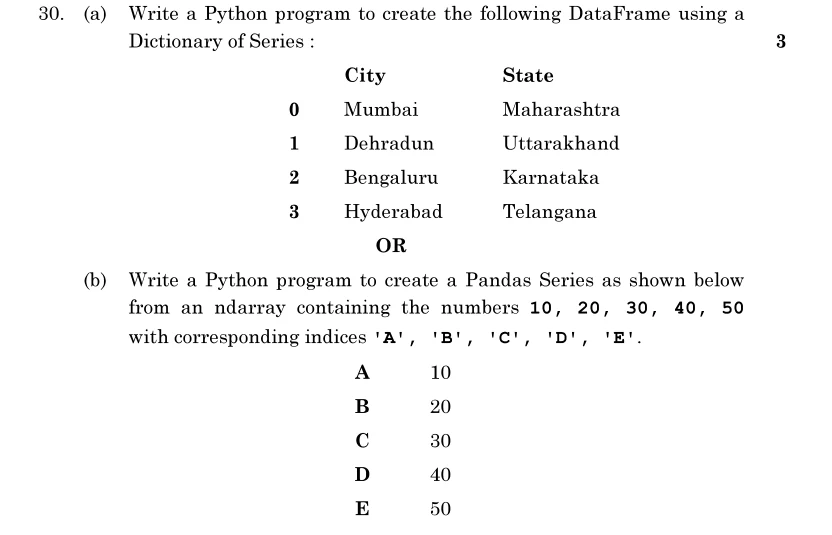
Show answer
(a)
import pandas as pd
city = pd.Series(['Mumbai', 'Dehradun', 'Bengaluru', 'Hyderabad'])
state = pd.Series(['Maharashtra', 'Uttarakhand', 'Karnataka', 'Telangana'])
df = pd.DataFrame({'City': city, 'State': state})
print(df)
OR (b)
import pandas as pd
import numpy as np
arr = np.array([10, 20, 30, 40, 50])
s = pd.Series(arr, index=['A', 'B', 'C', 'D', 'E'])
print(s)

Show answer
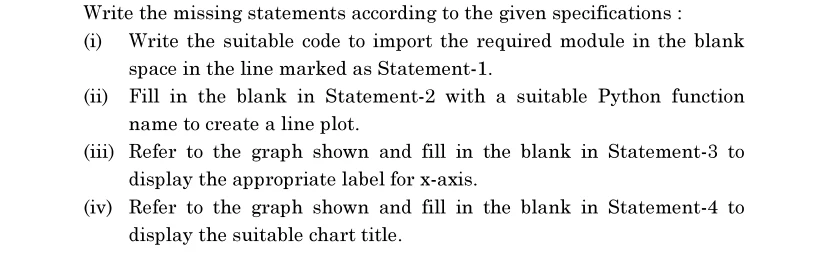
(i) import matplotlib.pyplot as plt (ii) plt.plot(days, temp) (iii) plt.xlabel('Days') (iv) plt.title('Temperature Over 5 Days')
Show answer
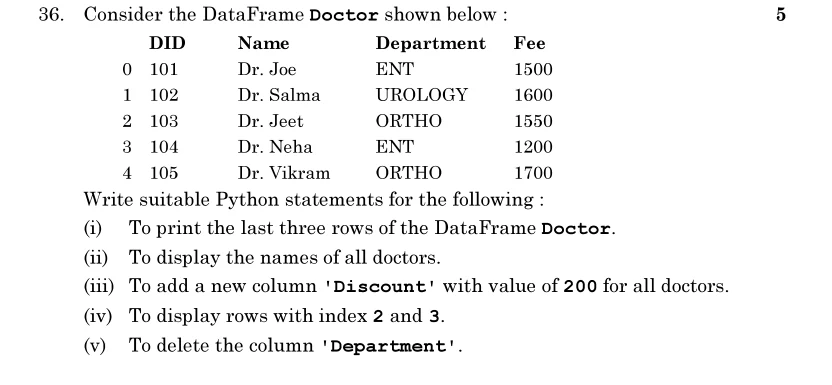
print(Doctor.tail(3))                          # (i)
print(Doctor['Name'])                          # (ii)
Doctor['Discount'] = 200                       # (iii)
print(Doctor.loc[2:3])                         # (iv)
Doctor = Doctor.drop('Department', axis=1)     # (v)
CBSE Board Paper 2024 – 11 questions
Show answer
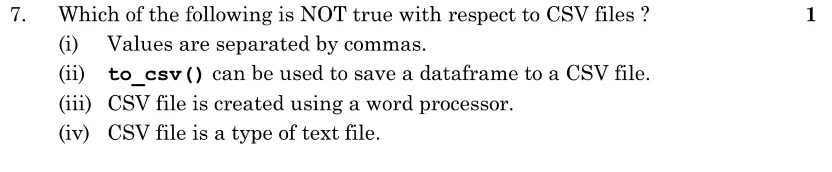
(iii) – a CSV file is a plain text file; it is not created with a word processor.
Show answer
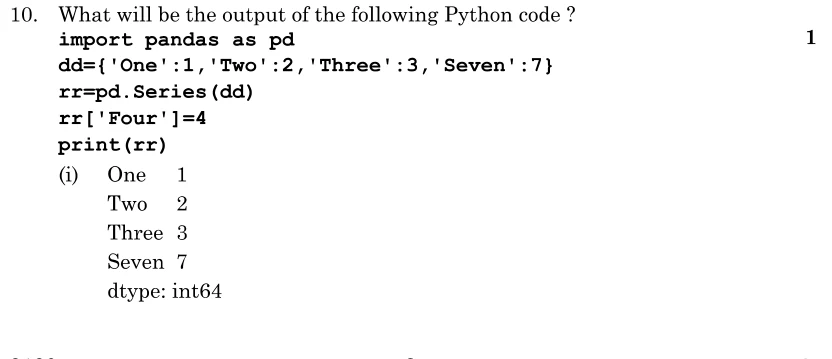
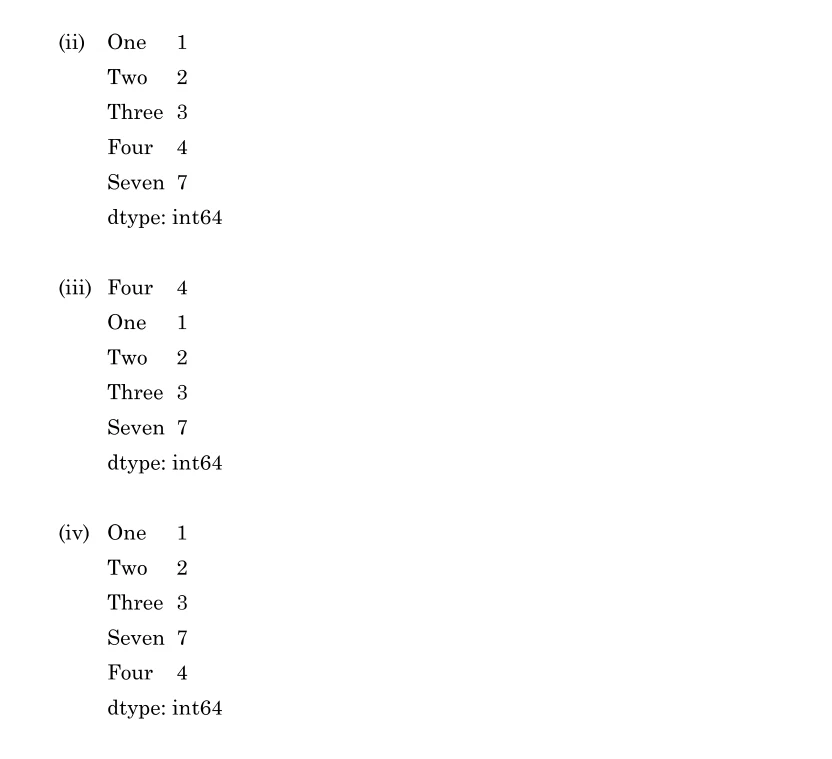
(iv) – the new label 'Four' is added at the end of the Series.
Show answer
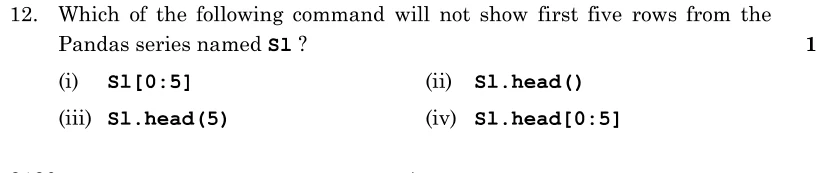
(iv) S1.head[0:5] – head is a method and must be called with ( ), not sliced with [ ].
Show answer
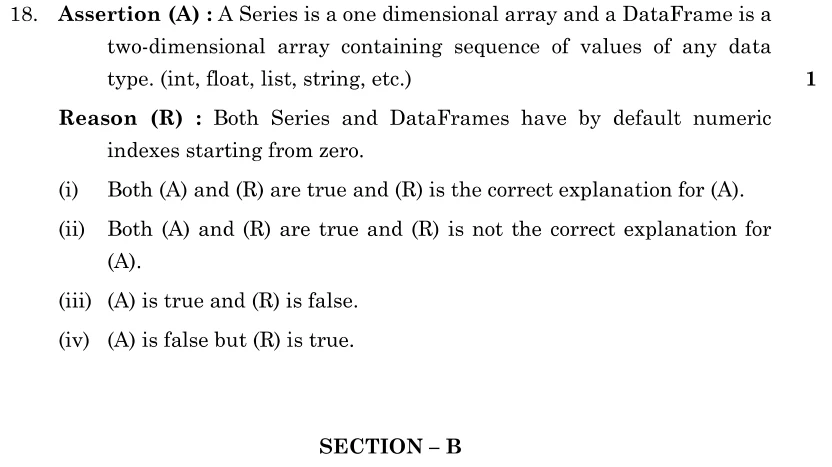
(ii) – both statements are true, but default numeric indexes do not explain why a Series is 1-D and a DataFrame is 2-D.
Show answer
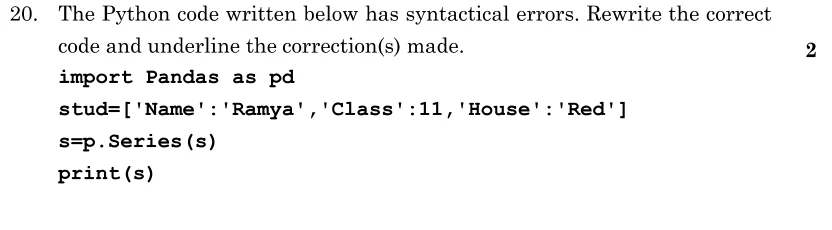
Corrections: Pandas → pandas, [ ] → { } (dictionary), stud used in Series, p → pd.
import pandas as pd
stud = {'Name': 'Ramya', 'Class': 11, 'House': 'Red'}
s = pd.Series(stud)
print(s)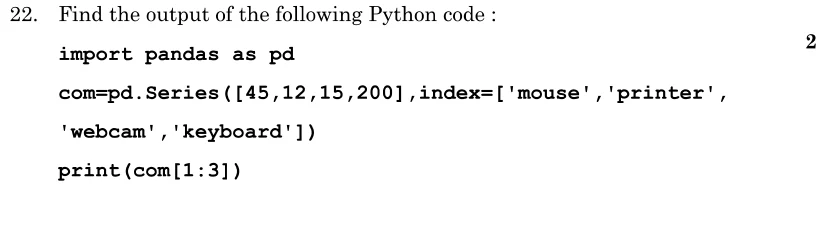
Show answer
printer    12
webcam     15
dtype: int64
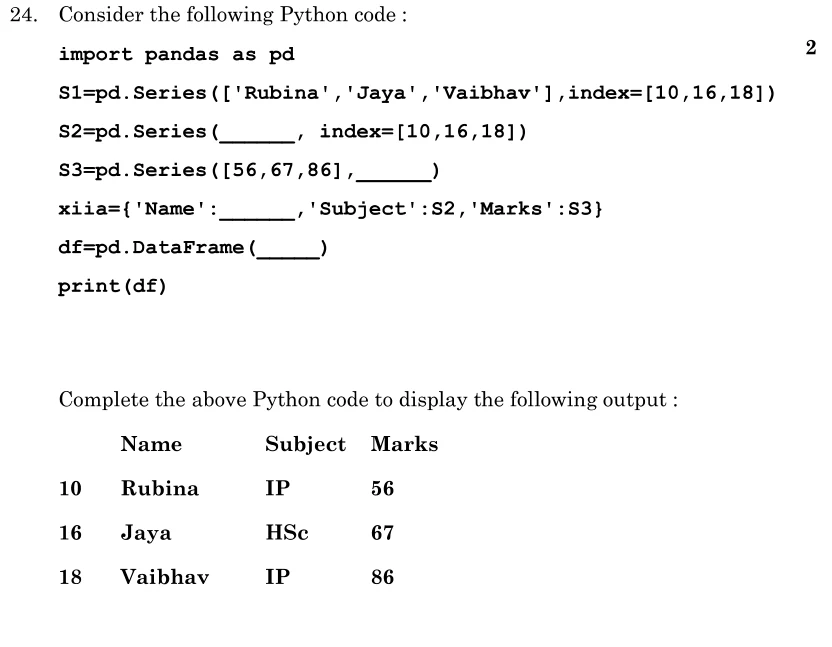
Show answer
S2 = pd.Series(['IP', 'HSc', 'IP'], index=[10, 16, 18])
S3 = pd.Series([56, 67, 86], index=[10, 16, 18])
xiia = {'Name': S1, 'Subject': S2, 'Marks': S3}
df = pd.DataFrame(xiia)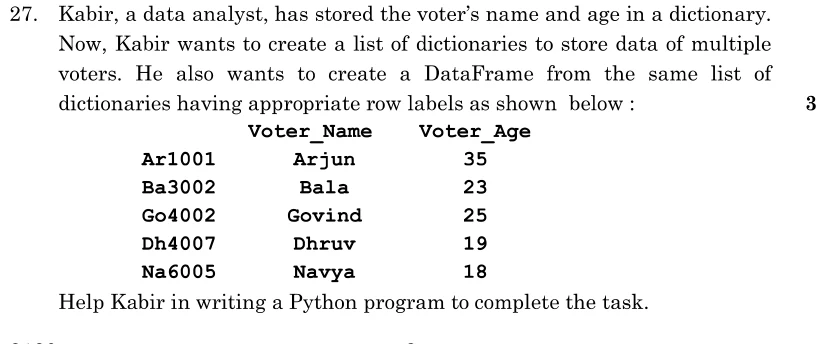
Show answer
import pandas as pd
voters = [{'Voter_Name': 'Arjun', 'Voter_Age': 35},
          {'Voter_Name': 'Bala', 'Voter_Age': 23},
          {'Voter_Name': 'Govind', 'Voter_Age': 25},
          {'Voter_Name': 'Dhruv', 'Voter_Age': 19},
          {'Voter_Name': 'Navya', 'Voter_Age': 18}]
df = pd.DataFrame(voters, index=['Ar1001', 'Ba3002', 'Go4002', 'Dh4007', 'Na6005'])
print(df)
Show answer
password.loc[7] = ['abc123', 'alphanumeric', 12.8]     # (i)
password = password.drop(2)                            # (ii)
password = password.drop('Frequency', axis=1)          # (iii)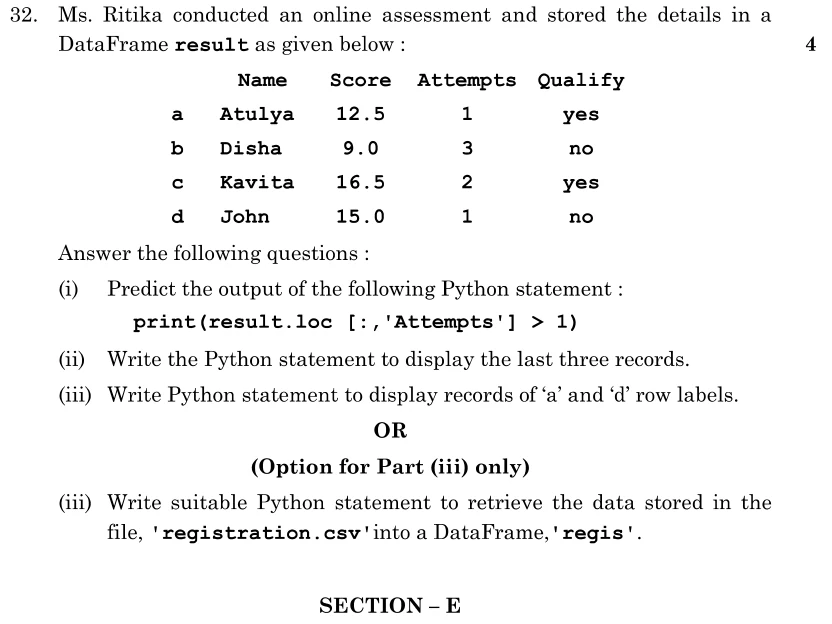
Show answer
(i)
a    False
b     True
c     True
d    False
Name: Attempts, dtype: bool
(ii) and (iii):
print(result.tail(3))              # (ii)
print(result.loc[['a', 'd']])      # (iii)
regis = pd.read_csv('registration.csv')     # OR (iii)
Show answer
(a) Bar chart:
import matplotlib.pyplot as plt
Fruits = ['Apple', 'Guava', 'Papaya', 'Grapes', 'Mango']
Price = [150, 70, 50, 30, 120]
plt.bar(Fruits, Price)
plt.title('Price of Fruits')
plt.xlabel('Fruits')
plt.ylabel('Price (Rs)')
plt.savefig('fruits.png')
plt.show()
OR (b) Line chart:
import matplotlib.pyplot as plt
month = ['April', 'May', 'June', 'July', 'August']
co2 = [40, 50, 30, 60, 20]
plt.plot(month, co2)
plt.title('Month wise CO2 emission')
plt.xlabel('Month')
plt.ylabel('Percentage')
plt.savefig('emission.png')
plt.show()
CBSE Board Paper 2023 – 11 questions
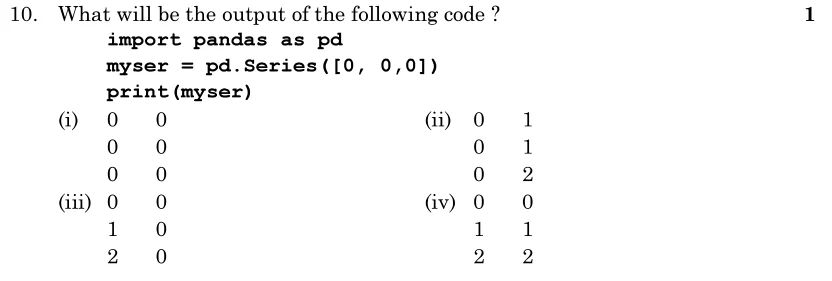
Show answer
(iii) – default index 0, 1, 2 with value 0 in each row (plus dtype: int64).

Show answer
(ii) Dataframe

Show answer
(iii) bar – a bar chart compares values of different salesmen (categories).

Show answer
(iii) / C – Assertion is true, Reason is false. With the + operator a missing label gives NaN; missing values are filled with 0 only when we use add() with fill_value=0.

Show answer
import pandas as pd
country = pd.Series(['New Delhi', 'London', 'Copenhagen', 'Bangkok'],
                    index=['India', 'UK', 'Denmark', 'Thailand'])
print(country)
Show answer
2*(3,10) repeats the tuple, so data = (3, 10, 3, 10).
0     3
1    10
2     3
3    10
dtype: int64

Show answer
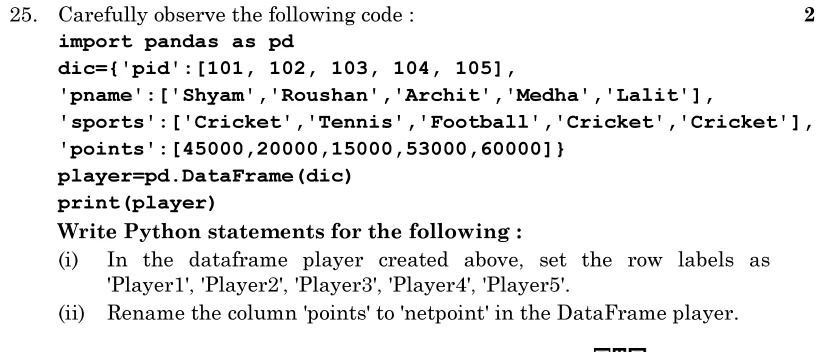
player.index = ['Player1', 'Player2', 'Player3', 'Player4', 'Player5']   # (i)
player.rename(columns={'points': 'netpoint'}, inplace=True)               # (ii)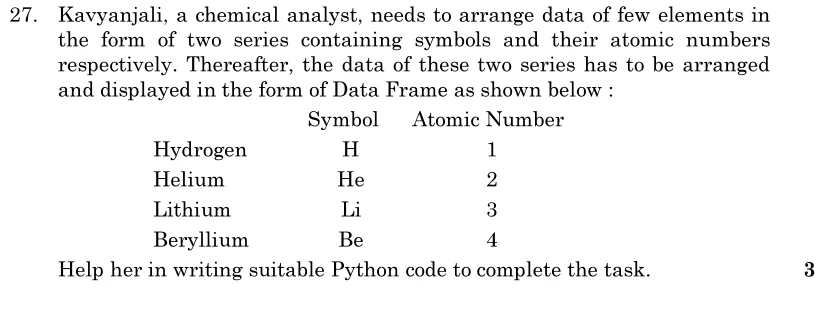
Show answer
import pandas as pd
names = ['Hydrogen', 'Helium', 'Lithium', 'Beryllium']
symbol = pd.Series(['H', 'He', 'Li', 'Be'], index=names)
atomic = pd.Series([1, 2, 3, 4], index=names)
elements = pd.DataFrame({'Symbol': symbol, 'Atomic Number': atomic})
print(elements)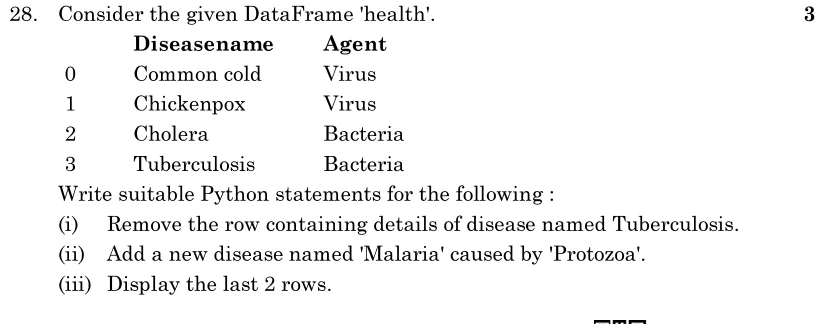
Show answer
health = health.drop(3)                       # (i) row of Tuberculosis (index 3)
health.loc[4] = ['Malaria', 'Protozoa']       # (ii)
print(health.tail(2))                         # (iii)

Show answer
Line graph:
import matplotlib.pyplot as plt
smarks = [10, 40, 30, 60, 55]
sname = ["Sahil", "Deepak", "Anil", "Ravi", "Riti"]
plt.plot(sname, smarks)
plt.title("Marks secured by students in Term-1")
plt.xlabel("Student Name")
plt.ylabel("Marks Scored")
plt.show()
OR – bar graph:
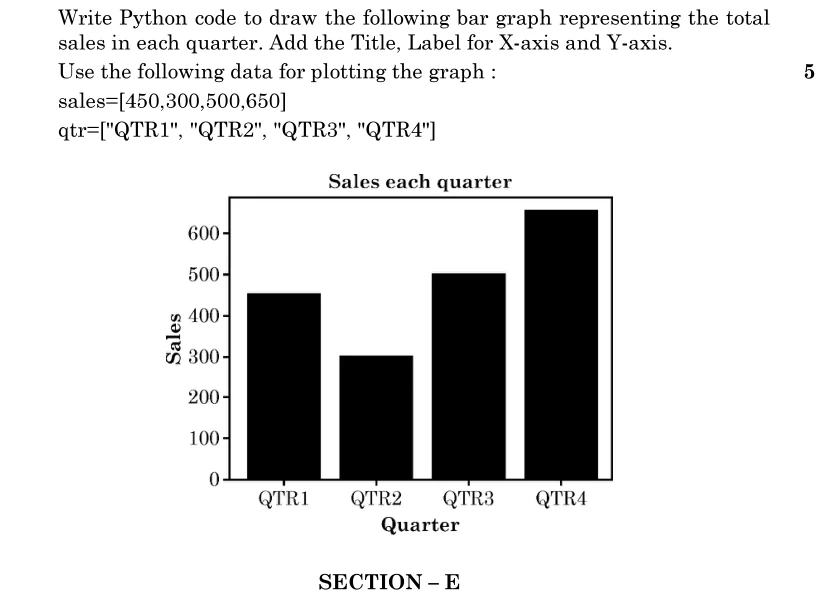
import matplotlib.pyplot as plt
sales = [450, 300, 500, 650]
qtr = ["QTR1", "QTR2", "QTR3", "QTR4"]
plt.bar(qtr, sales)
plt.title("Sales each quarter")
plt.xlabel("Quarter")
plt.ylabel("Sales")
plt.show()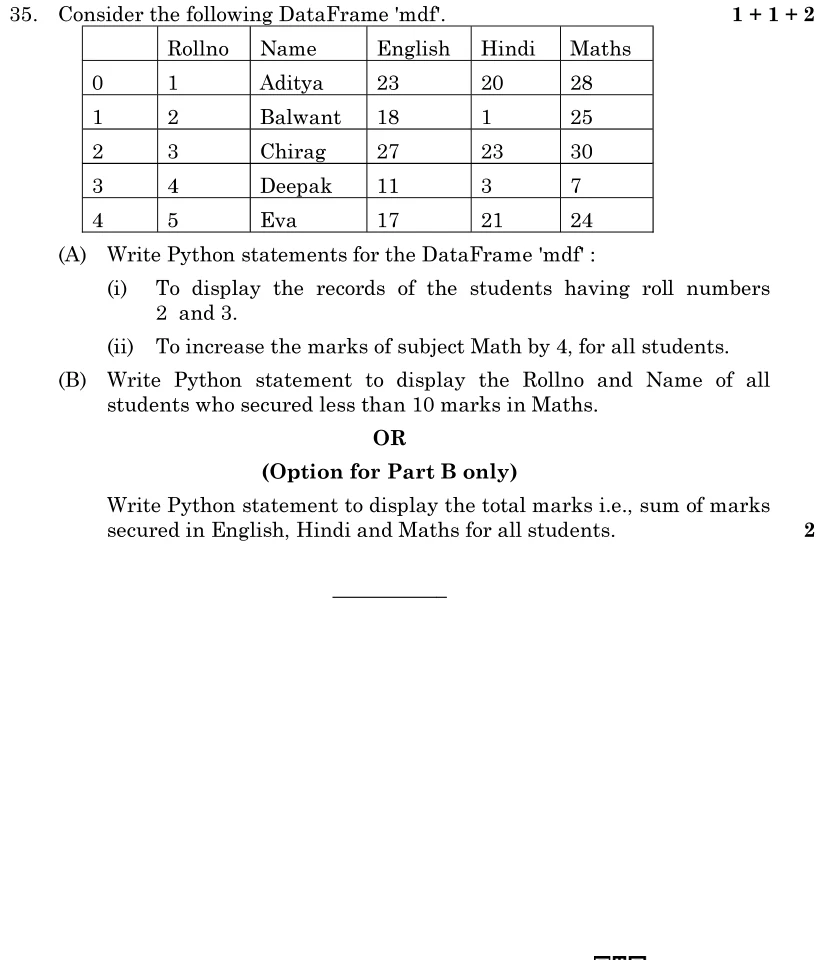
Show answer
print(mdf.loc[1:2])                     # (A)(i) roll numbers 2 and 3 (row labels 1 and 2)
mdf['Maths'] = mdf['Maths'] + 4         # (A)(ii)
print(mdf[mdf['Maths'] < 10][['Rollno', 'Name']])   # (B)
OR (B):
print(mdf['English'] + mdf['Hindi'] + mdf['Maths'])
Next: Unit 2 – start with SQL Math Functions.